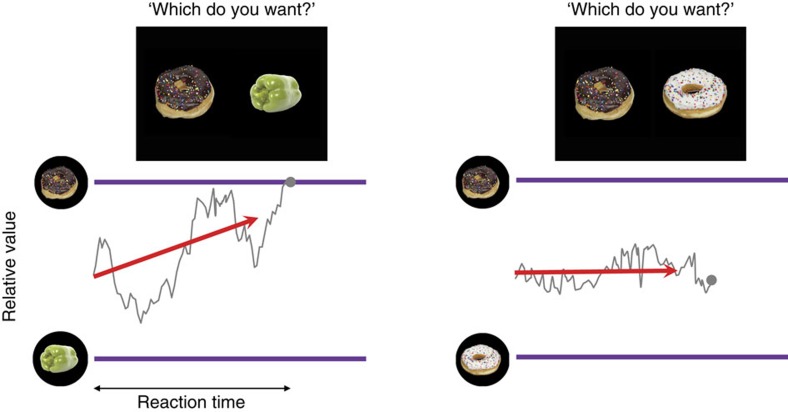
Figure 1. DDMs for value-based decisions.
The purple lines represent the decision boundaries. The red arrows indicate the mean drift rate. The grey fluctuating traces illustrate sample trajectories of a particle that drifts in the space of relative value between two given options. (left) If an option is preferred (that is, yields higher reward) than the other, the mean drift is biased toward the boundary of preferred option, making the particle to hit the decision boundary within a relatively short time. (right) However, if the given options are equally good, DDM assumes a mean drift without any bias, requiring much longer time for the particle to hit either decision boundary—even if both options are highly rewarding.

