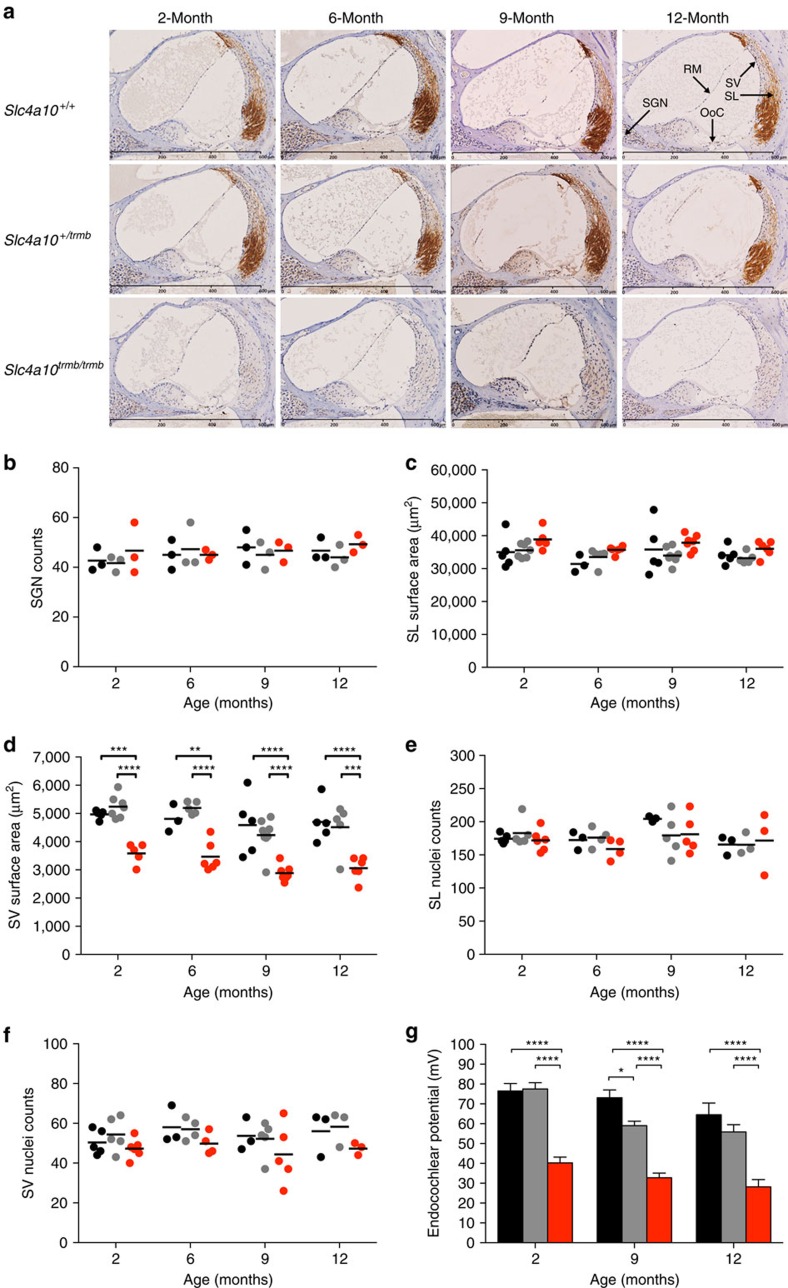
Figure 5. Cochlear expression of Slc4a10 morphology of the lateral wall and endocochlear potential in trombone mice.
(a) Immunohistochemical DAB staining of cochlear sections identifies Slc4a10 expression in the SL fibrocytes of Slc4a10+/+ and Slc4a10+/trmb mice. No DAB staining of Slc4a10trmb/trmb sections is observed at any of the time points tested. Scale bar, 600 μm. Number of cochleae imaged (one per mouse) for each genotype at 2-, 6-, 9- and 12 months of age were: Slc4a10+/+ n=5, 5, 6, 6; Slc4a10+/trmb n=7, 4, 5, 6; and Slc4a10trmb/trmb n=4, 3, 5, 6, respectively. (b) SGN counts in Slc4a10+/+, Slc4a10+/trmb and Slc4a10trmb/trmb mice shows there are no differences across genotype, or with age. Counts averaged from individual mice (N=3) for each genotype at each age. (c) Analysis of the cross-sectional surface area of the SL shows there are no differences across genotypes, or with age. (d) Analysis of the SV show there is a significant reduction in the cross-sectional surface area in Slc4a10trmb/trmb mice compared with Slc4a10+/+ and Slc4a10+/trmb mice, and this is consistent across the ages tested. The SL and SV surface areas are averaged from individual mice for each genotype at 2-, 6-, 9- and 12 months of age: Slc4a10+/+ n=5, 3, 5, 5; Slc4a10+/trmb n=7, 5, 8, 5; and Slc4a10trmb/trmb n=5, 6, 7, 6, respectively. (e,f) Comparison of SL and SV nuclei counts shows there are no differences across genotype, or with age. The nuclei counts are averaged from individual mice for each genotype at 2-, 6-, 9- and 12 months of age: Slc4a10+/+ n=5, 3, 3, 3; Slc4a10+/trmb n=5, 4, 4, 3; and Slc4a10trmb/trmb n=6, 5, 4, 3, respectively. (g) The endocochlear potential is chronically reduced in Slc4a10trmb/trmb mice compared with controls. Measurements averaged for each genotype at 2-, 9- and 12 months of age: Slc4a10+/+ n=6, 6, 8; Slc4a10+/trmb n=10, 12, 11; and Slc4a10trmb/trmb n=8, 6, 9, respectively. Slc4a10+/+ (black circles/bars), Slc4a10+/trmb (grey circles/bars), Slc4a10trmb/trmb (red circles/bars). Data correspond to mean±s.e.m., and statistical significance determined using two-way ANOVA with Tukey's multiple comparisons test. *P<0.05; **P<0.01; ***P<0.001, ****P<0.0001. ANOVA, analysis of variance.

