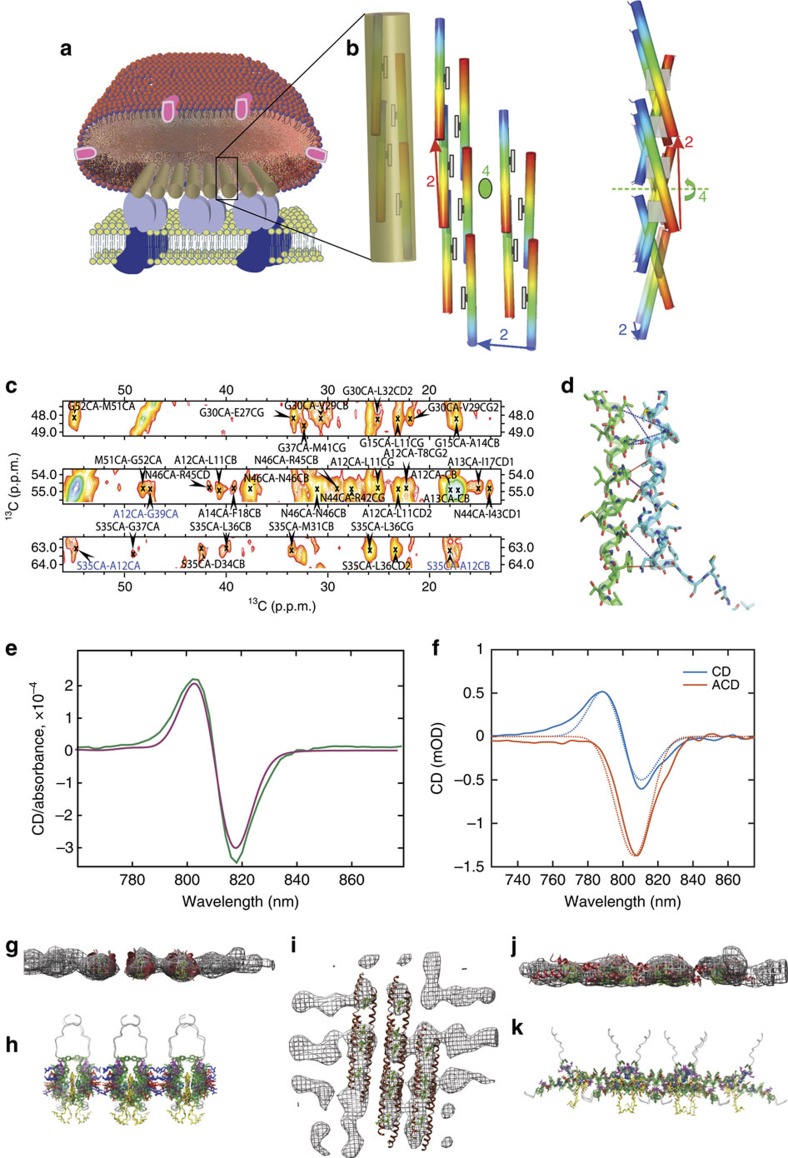
Figure 3. Structure calculation data and validation.
(a) Cartoon of the carotenosomes. (b) Final structure of the baseplate shown as a 3D cartoon highlighting the degrees of freedom for the symmetry with numbers (Supplementary Note 2) showing CsmA helices with rainbow colours indicating N- and C-terminal in blue and red, respectively, with added drawings of the BChl a ligands (coordinated to H25) as grey boxes. The cluster of monomers covered by the transparent cylinder constitutes the rods in the cryo-EM density model. (c) Representative strip plot from a solid-state NMR DARR (200 ms mixing time) spectrum with peak assignment annotated highlighting inter-chain constraints in blue and intra chain in black, the average signal-to-noise ratio for the three highlighted peaks assigned to inter-chain contacts was estimated to 4.1. (d) Molecular representation of the interface between two CsmA monomers showing inter-chain constraints as blue dotted lines and possible long-range constraints in red. (e) Overlay of experimental (green) and calculated (magenta) isotropic CD spectra of the carotenosomes from Cba. tepidum in baseplate absorption region at 77 K. Corresponding spectrum for the Qy region is shown in Supplementary Fig. 9. (f) Overlay experimental (solid lines) and calculated (dotted lines) of isotropic CD and anisotropic CD (ACD) spectra in the near infrared region acquired at room-temperature (data from Supplementary Fig. 5), (g,i,j) Cryo-EM density model as a mesh overlaid BChl a-CsmA structures derived from solid-state NMR and visualized by Chimera67, Red: the CsmA protein chain, green: BChl a, note that the threshold for visualizing the density is set relatively high to increase readability of the figure. (h,k) The baseplate structures from the corresponding angles are shown as cartoon diagrams below the meshes (g,j). Yellow: BChl a, Green: aromatic, Red: negatively charged and Blue: positively charged residues (see also Fig. 4).

