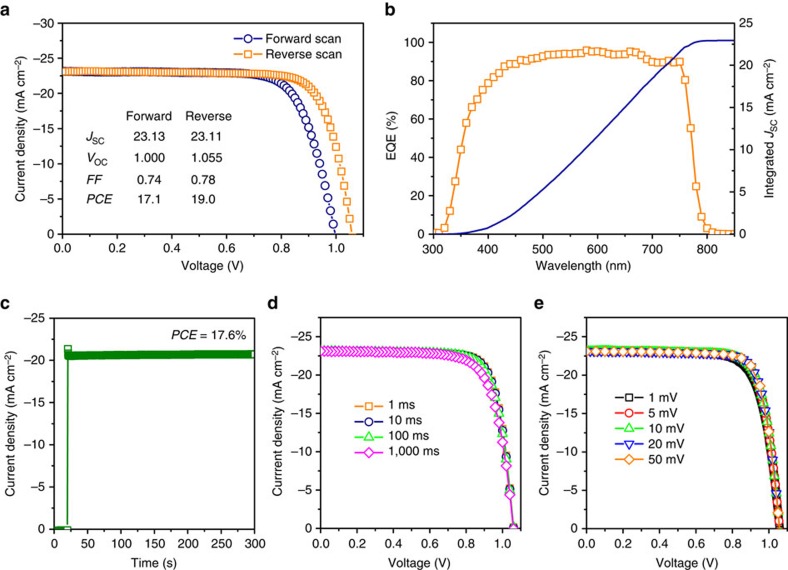
Figure 4. Device performance of the planar heterojunction PSC.
(a) JV curves of one of the highest-performing devices measured in the forward and reverse scan directions at a rate of 10 mV per step under 100 mW cm−2 AM 1.5G illumination. (b) EQE spectrum of the solar cell measured at the short-circuit condition (orange squares). The integration of the EQE spectrum with the AM 1.5G photon flux is also shown (blue line) and agrees to within 1% of the short circuit current density obtained from JV measurements. (c) Steady-state measurement of the photocurrent near the maximum power point at 0.85 V. (d) JV curves of the same device measured with different step delay times and (e) voltage step sizes. All the above measurements were carried out after light soaking for ∼20 min.

