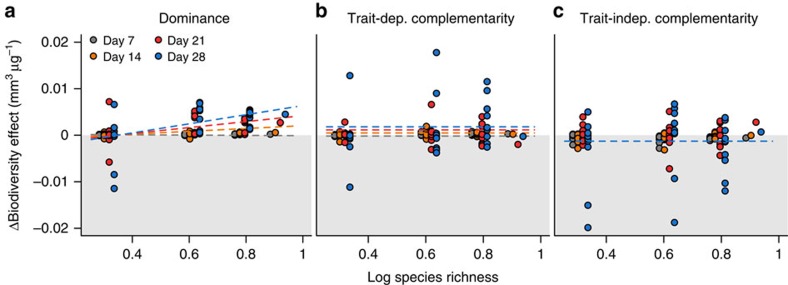
Figure 2. Stress-induced changes in biodiversity effects.
Changes in (a) dominance, (b) trait-dependent and (c) trait-independent complementarity effect at day 8 (grey), 14 (orange), 21 (red) and 28 (blue) of the experiment. Regression lines correspond to the predicted stress-induced changes biodiversity effects by the linear mixed effects models using species richness, atrazine concentration and day as predictor variables (Table 2, model 1). Note that regression lines overlap for the trait-independent complementarity effect.

