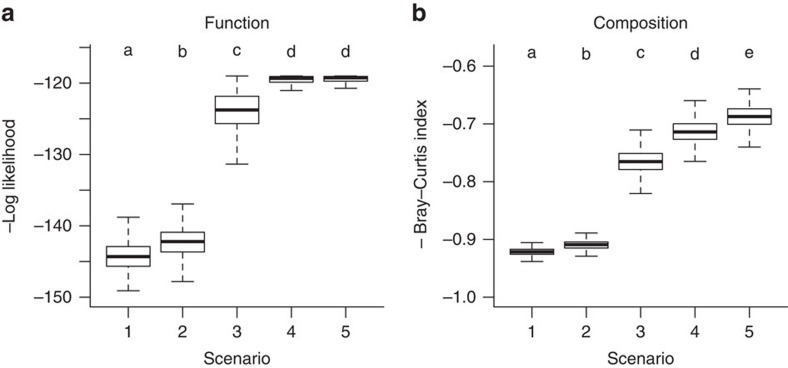
Figure 3. Community model predictions under different scenarios of stress effects.
Boxplots of the negative log-likelihood of the change in community productivity (a) and average negative Bray–Curtis dissimilarity index (b) for five scenarios of stress-induced effects in the per capita strength of species interactions. Scenario 1 is the baseline scenario without interspecific interaction (Aij=0). Scenario 2 corresponds to equal inter- and intraspecific interaction strength (Aii=Aij). Scenario 3 corresponds to a constant ratio of inter- to intraspecific competition (Aii,0/Aij0=Aii250/Aij250). Scenario 4 corresponds to a constant per capita strength of interspecific interactions (Aij0=Aij250). Scenario 5 did not impose any limitations to changes in per capita interaction strength. Higher values indicate a better model fit and scenarios that do not share a common letter are significantly different (Bonferroni-corrected Wilcoxon signed-rank test: P<0.05). Boxplot whiskers correspond to maximal 1.5 times the interquartile range.

