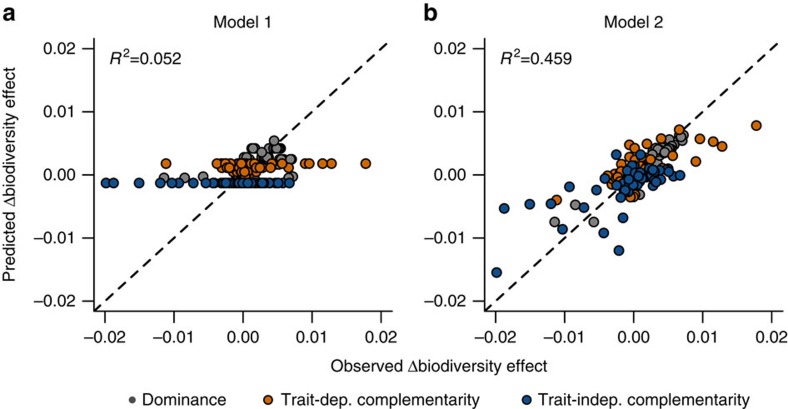
Figure 4. Predicted stress-induced changes in biodiversity effects.
Predicted plotted against observed changes in the dominance (grey), trait-dependent complementarity (orange) and trait-independent complementarity effect (blue) for linear regression models (a) including diversity and day (Table 2, model 1) and (b) the weighted mean strength of per capita interactions and weighted mean species stress tolerance as predictor variables (Table 2, model 2).

