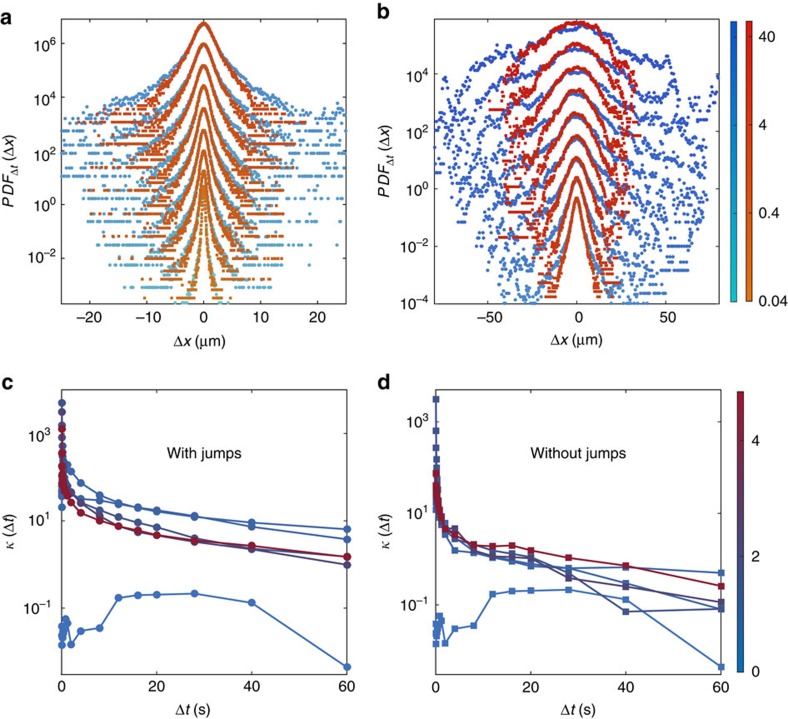
Figure 4. Probability distribution functions of particle displacements in the Hele–Shaw experiments.
(a,b) Evolution of the PDF of displacements PDFΔt(Δx) of the colloids with the time interval Δt when considering the jumps (blue curves) or not (red curves) for Nc=(4.84±0.13) × 106 cells ml−1. The curves have been shifted and separated into two figures for clarity. a corresponds to Δt∈[0.04, 0.8]s, while b corresponds to Δt∈[1.2, 48]s (colour bars: Δt in seconds). Both distributions exhibit exponential-like tails at short time which reflect the presence of loop-like perturbations and jumps in the dynamics. (c,d) Modified kurtosis κ of the PDF of displacements as a function of the time interval Δt with/without jumps respectively. The colours code for the cell concentration (unit: 106 cells ml−1). The PDFs with jumps show slower convergence to the Gaussian limit, as the plots in a,b also suggest.

