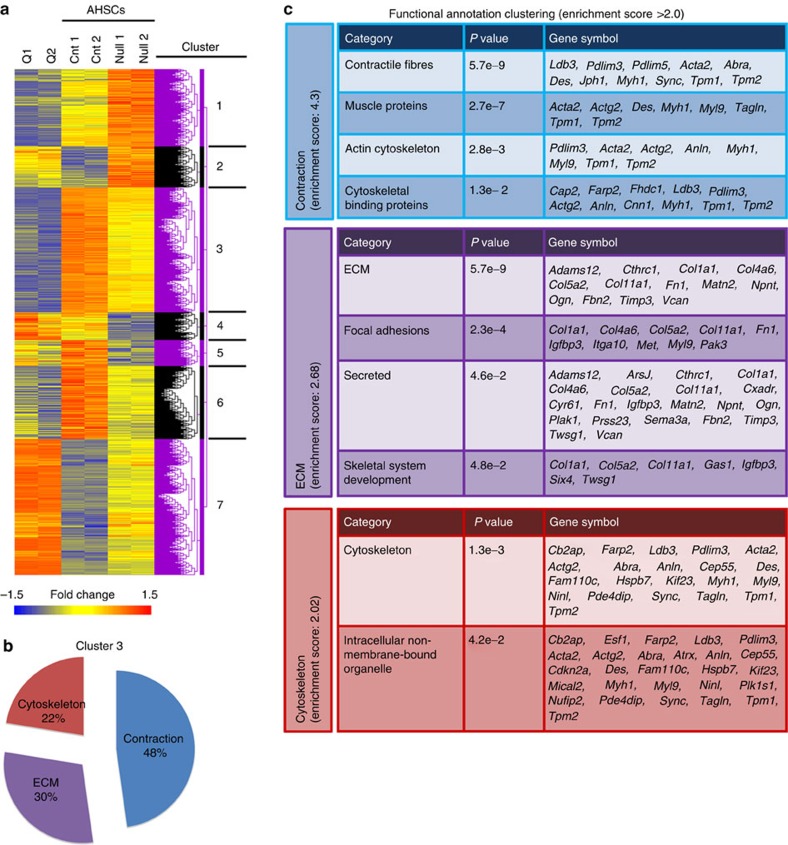
Figure 2. Integrin beta-1 is required for multiple pro-fibrotic features in activated HSCs.
(a) Heatmap and cluster analysis showing gene expression changes (1.5-fold; P<0.05) in biological duplicates of activated (A) control (‘Cnt’) HSCs and following integrin beta-1 inactivation (‘Null’). Quiescent (Q) HSCs are also included for comparison. Seven clusters were identified based on upregulated (red), downregulated (blue) and intermediate (yellow) gene expression. (b,c) Functional annotation by gene ontology for enrichment in Cluster 3. Proportions are shown in b. Individual categories and the genes underlying them are shown in c.

