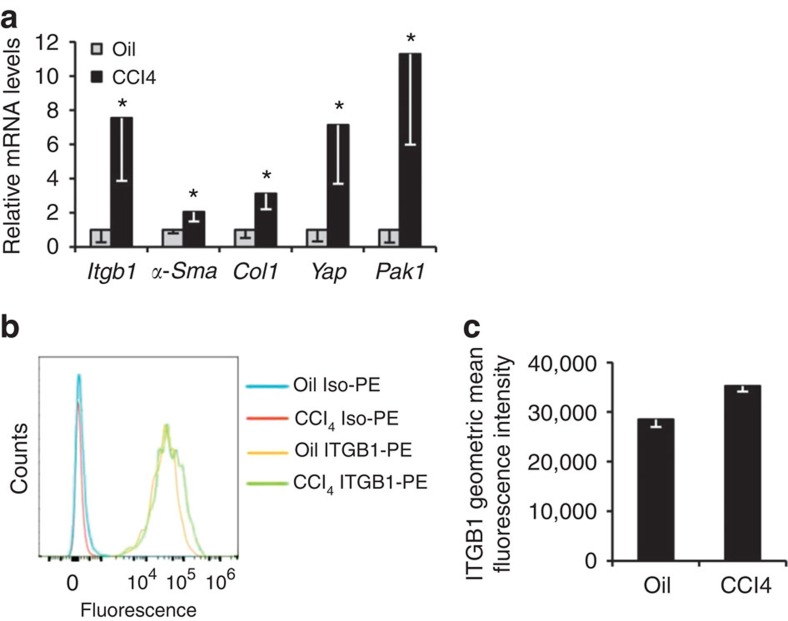
Figure 7. Analysis of in vivo activated HSCs.
(a) Expression analysis by qRT–PCR of in vivo activated HSCs extracted from wild-type mice following CCl4 injections compared with olive oil control. (b,c) FACS analysis for integrin beta-1 on in vivo activated HSCs extracted from Pdgfrb-BAC-eGFP mice following CCl4-induced fibrosis compared with olive oil control. Fluorescence intensity is shown using a phycoerythrin (PE)-conjugated antibody to integrin beta-1 (integrin beta-1-PE) and isotype control (Iso-PE) (b). Graphical representation of integrin beta-1 fluorescence demonstrating increased integrin beta-1 on unpermeabilized live HSCs the context of liver fibrosis (c). All experiments are n=4. Two-tailed unpaired t-test was used for statistical analysis. Data in bar charts show means±s.e.m. *P<0.05, **P<0.01.

