
Figure 4. Utilizing PEEM insights for device simulation.
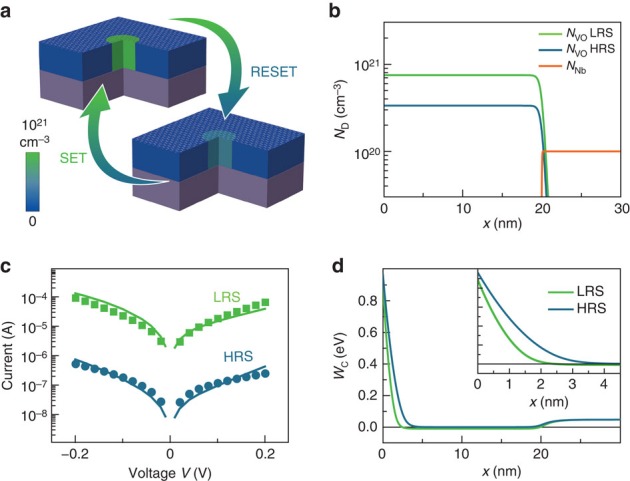
(a) Schematic of the switching filament in the HRS and in the LRS derived from the spectromicroscopic information. Filament diameter is 500 nm. The colour scale refers to the oxygen-vacancy concentration used for the model as described in b. (b) Donor distributions as a function of depth x used for the simulation of the LRS and the HRS. (c) Experimental read-out sweeps (green and blue data points for the LRS and HRS, respectively) of the device in Fig. 3 with simulated I–V characteristics based on the model in a,b (green and blue lines). (d) Profiles of the energy of the conduction-band edge WC(x) as a function of depth at zero bias for the LRS and the HRS.