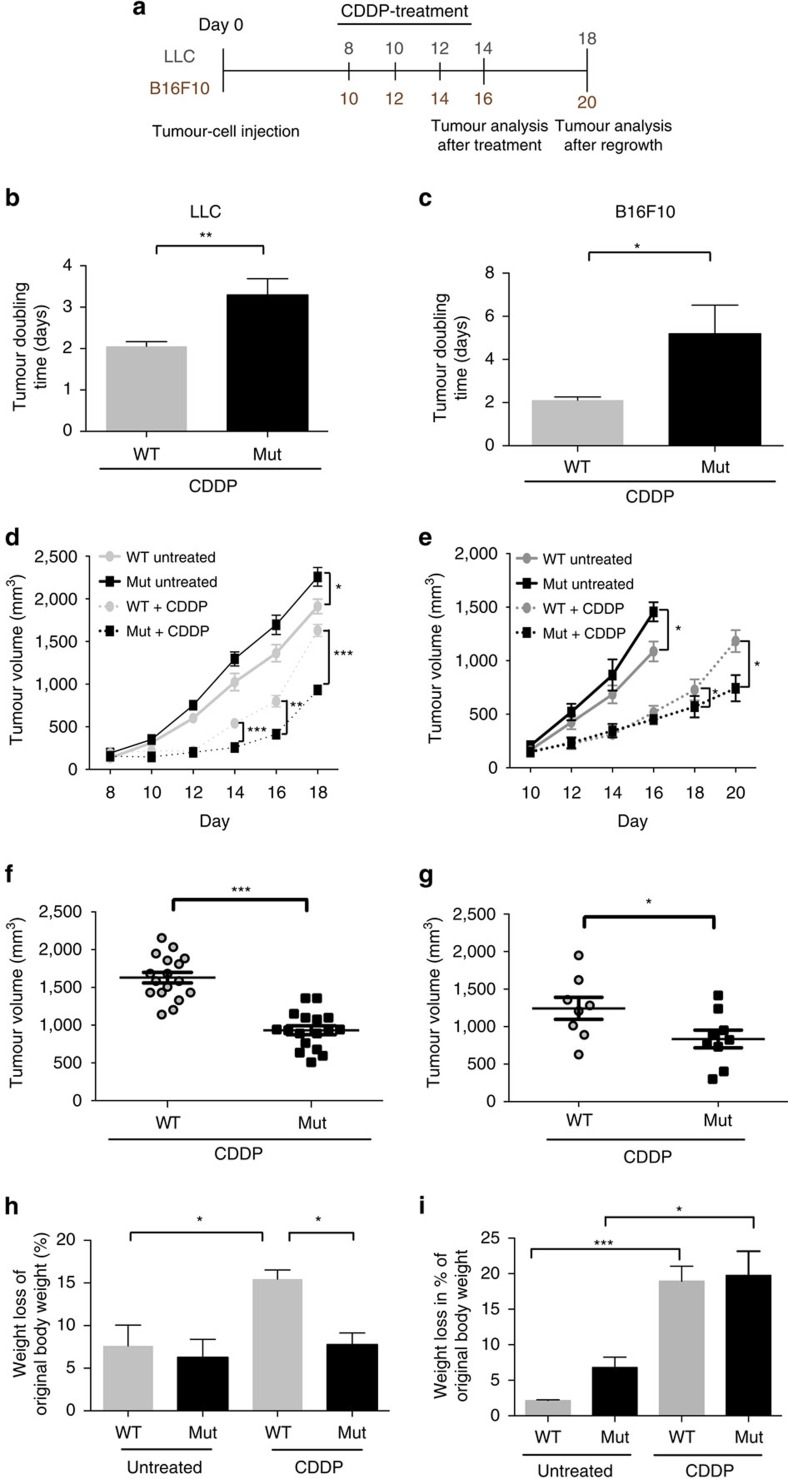
Figure 1. Loss of myeloid cell VEGF-A delays tumour growth and ameliorates cancer cachexia after chemotherapy.
(a) Schematic representation of experimental procedure to study tumour regrowth of LLC and B16F10 isografts in WT and mutant (Mut, LysMCre/VEGFf/f) mice. Cells (107) of the tumour cell line were subcutanously (s.c.) injected into mice and 8 mg kg−1 cisplatin (CDDP) was administered by i.p. at the indicated time points. Tumours were allowed to grow until the maximum size was reached. (b) Determination of speed of tumour growth of LLC isografts after chemotherapy. Tumour doubling time was calculated from the last treatment and the end volume for a total period of 6 days (WT, n=17; Mut, n=17). (c) Determination of speed of tumour growth of B16F10 isografts after chemotherapy. Tumour doubling time was calculated from the last treatment and the end volume for a total period of 6 days (WT, n=8; Mut, n=8). (d) Graphical representation of tumour growth kinetics of untreated and cisplatin-treated LLC isografts after s.c. injection of tumour cells into different cohorts of mice (WT untreated, n=9; Mut untreated, n=11; WT+CDDP, n=17; Mut+CDDP, n=17). (e) Graphical representation of tumour growth and regrowth kinetics of cisplatin-treated B16F10 isografts after s.c. injection of tumour cells (WT untreated, n=6; Mut untreated, n=6; WT+CDDP, n=8; Mut+CDDP, n=8). (f) Tumour volumes of cisplatin-treated LLC isografts at endpoint day 18 (WT+CDDP, n=17; Mut+CDDP, n=17). (g) Tumour volumes of cisplatin-treated B16F10 isografts at endpoint day 18 (n≥9). (h) Body weight loss of untreated and cisplatin-treated LLC-bearing mice at endpoint day 18. Weight loss is given as percentage of the original body weight (WT: n≥4; Mut: n≥7). (i) Body weight loss of untreated and cisplatin-treated B16F10-bearing mice at endpoint. Weight loss is given as percentage of the original body weight (day 16 untreated, day 20 treated; WT: n≥5; Mut: n≥7). Bars represent mean values; error bars indicate s.e.m.; statistical significance was determined by an unpaired Student's t-test for two samples or by one-way analysis of variance followed by Bonferroni post-hoc test when more than two groups were compared. Statistical significance is indicated as *P<0.05, **P<0.01 and ***P<0.001.

