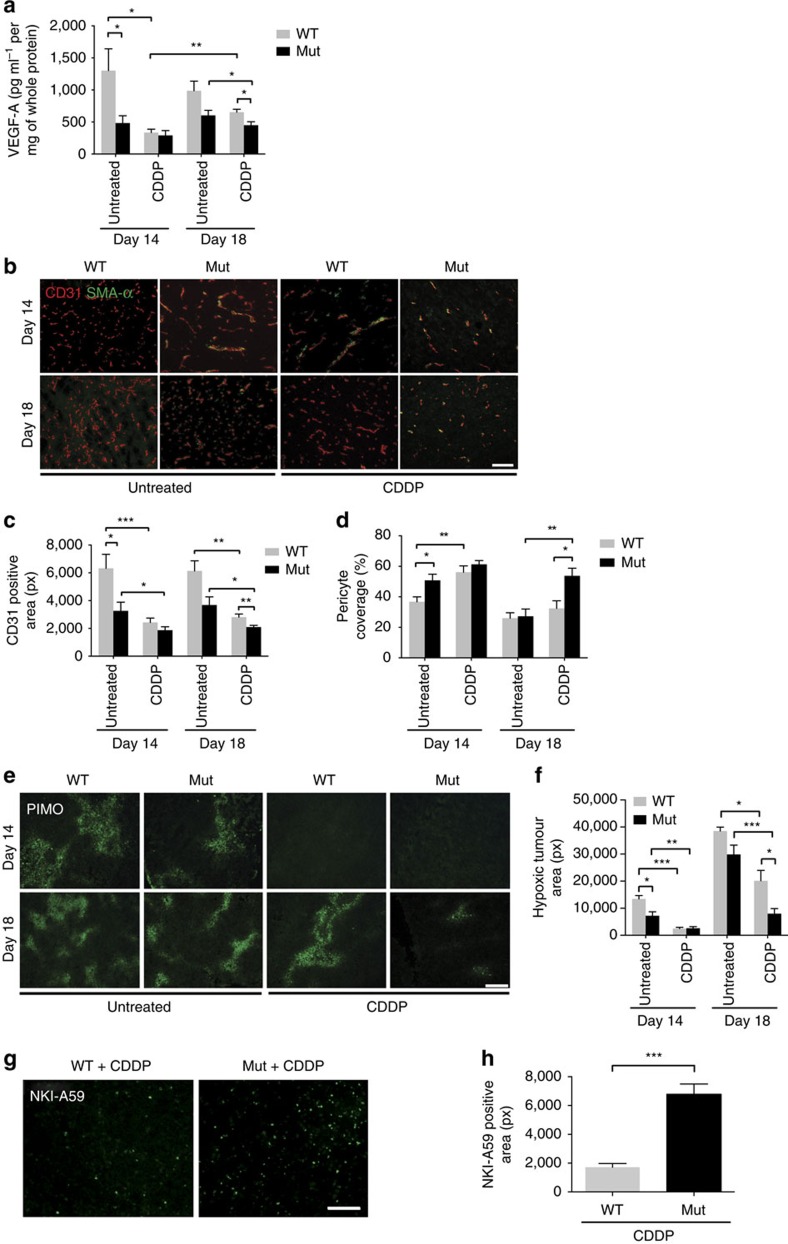
Figure 2. Targeting myeloid cell VEGF-A induces sustained vascular normalization.
(a) Determination of levels of VEGF protein in LLC tumour lysates from WT and mutant (mut, LysMCre/VEGFf/f) animals by ELISA (WT, n≥4; Mut, n≥4). (b) Representative photomicrographs of co-immunolabelled CD31 and SMA-α LLC tumour sections derived from WT and mutant mice. (c) Quantitative analysis of CD31 immunostaining shown in b (untreated, n>5; CDDP, n>6). (d) Quantification of pericyte coverage as assessed by co-localization studies in b. The fraction of pericyte coverage is given as the ratio of the number of SMA-α- to the number of CD31-positive cells (untreated, n=4; CDDP, n>5). (e) Microscopic images representing the degree of tumour hypoxia in WT and mutant animals under designated conditions. Pimonidazole (60 mg kg−1) was given by i.p. injection 1 h before killing and detected by the monoclonal antibody Mab-1. (f) Quantification of pimodinazole-positive areas in e (WT control, n=3; Mut control, n=5; WT+CDDP, n≥12; Mut+CDDP, n≥10). (g) Visualization of cisplatin–DNA adducts in WT and Mut tumour sections by immunofluorescent staining (day 14). (h) Quantitative analysis of g (n=5). Bars represent mean values; error bars indicate the s.e.m.; statistical significance was determined by an unpaired Student's t-test for two samples or by one-way analysis of variance followed by Bonferroni post-hoc test when more than two groups were compared. Statistical significance is indicated as *P<0.05, **P<0.01 and ***P<0.001. Scale bar, 100 μm.

