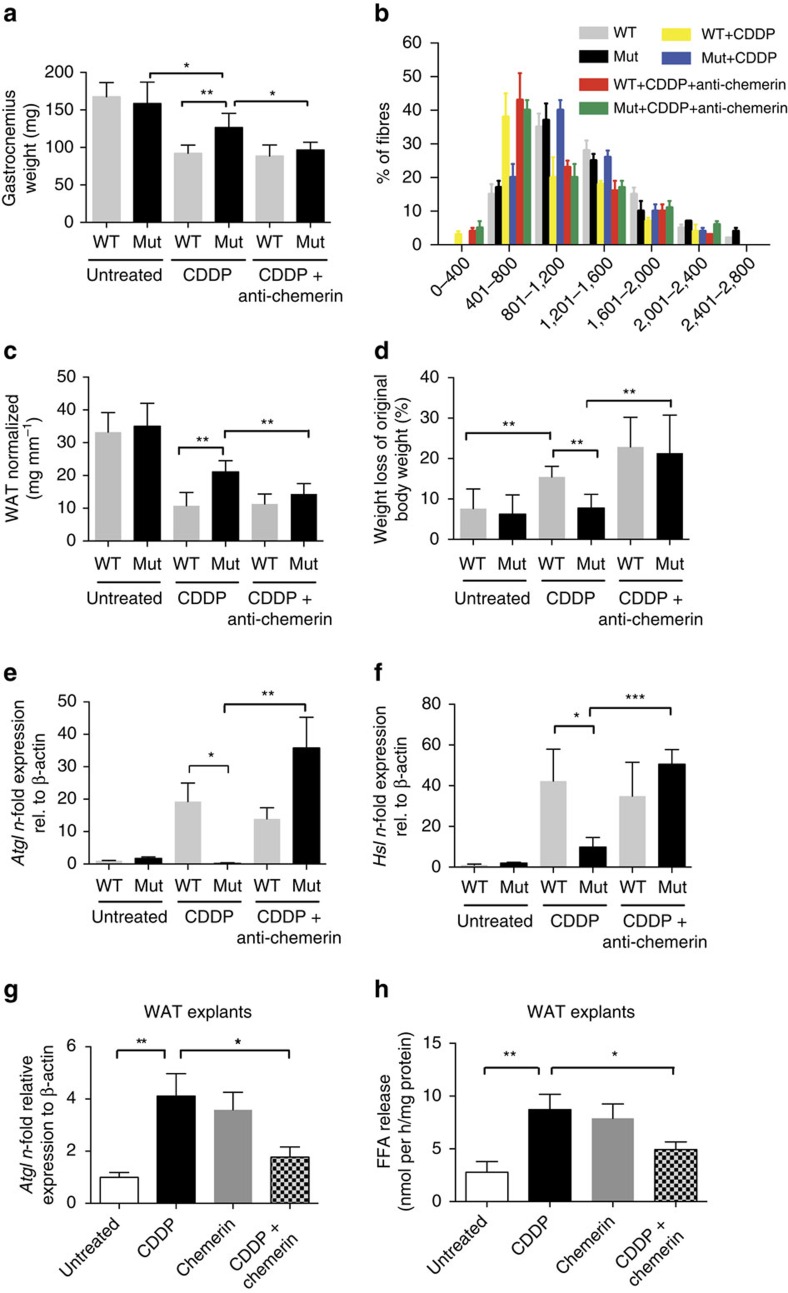
Figure 5. Chemerin protects Mut (LysMCre/VEGFf/f) mice from chemotherapy-induced lipolysis and skeletal muscle loss.
(a) Weight of gastrocnemius muscle in LLC tumour-bearing mice without treatment and after administration of CDDP alone or with chemerin-neutralizing antibody on day 18 (WT: n n≥4; Mut: n≥7). (b) The cross-sectional area of gastrocnemius muscle fibres from LLC tumour-bearing mice are represented as a frequency histogram from n=2 mice. The mean cross-sectional area of the fibres in μm2 is indicated on the x axis. (c) Amount of WAT normalized to tibia length of untreated, cisplatin-treated and cisplatin+anti-chemerin-treated LLC-bearing mice on day 18 (WT: n≥4; Mut: n≥7). (d) Weight loss of LLC tumour-bearing mice on day 18. Weight loss is given as percentage of the original body weight (WT: n≥4; Mut: n≥7). (e) N-fold change in gene expression of Atgl in gonadal fat tissue from LLC-bearing mice on day 18 (WT: n≥4; Mut: n≥7). (f) N-fold change in gene expression of Hsl in gonadal fat tissue from from LLC-bearing mice on day 18 (WT: n≥4; Mut: n≥7). (g) Quantification of levels of Atgl transcripts in explant cultures of WAT from C57/Bl6J-WT mice. Explants were treated for 24 h as indicated (n≥4). (h) Colorimetric determination of free fatty acid (FFA) release in supernatants from WAT explants treated as described in g (n≥4). Bars represent mean values; error bars indicate the s.e.m.; statistical significance was determined by one-way analysis of variance followed by Bonferroni post-hoc test when more than two groups were compared. Statistical significance is indicated as *P<0.05, **P<0.01 and ***P<0.001.

