Fig. 3.

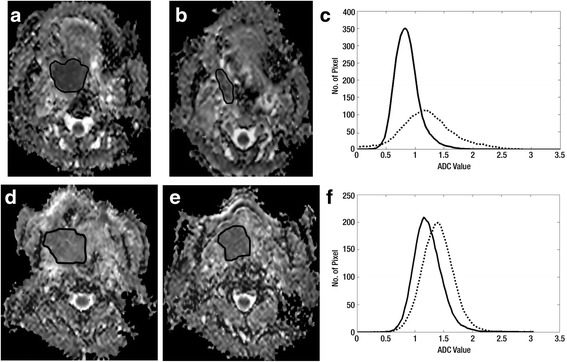
a-f. Analysis of the early intra-treatment ADC distribution curve for prediction of CRT response. ADC maps of a tonsil SCC (ROI) with local control; a pre-treatment, b two weeks intra-treatment, c ADC distribution curve pre-treatment (solid line) and two weeks intra-treatment (dashed line). ADC maps of a tongue SCC (ROI) with local failure; d pre-treatment, e two weeks intra-treatment, f ADC distribution curve pre-treatment (solid line) and two weeks intra-treatment (dashed line). The ADC distribution curve of the tumour with local failure shows less movement to the right side, (smaller increase in ADC mean) and a high skewness (skewness has fallen, but the short tail still remains on the positive left side) and the curve still has an acute peak with a high ADC kurtosis (kurtosis has fallen only slightly and remains high). {reproduced with permission of Radiology and [King AD, Chow KK, Yu KH, et al. Head and neck squamous cell carcinoma: diagnostic performance of diffusion-weighted MR imaging for the prediction of treatment response. Radiology. 2013 Feb;266:531–538]}
