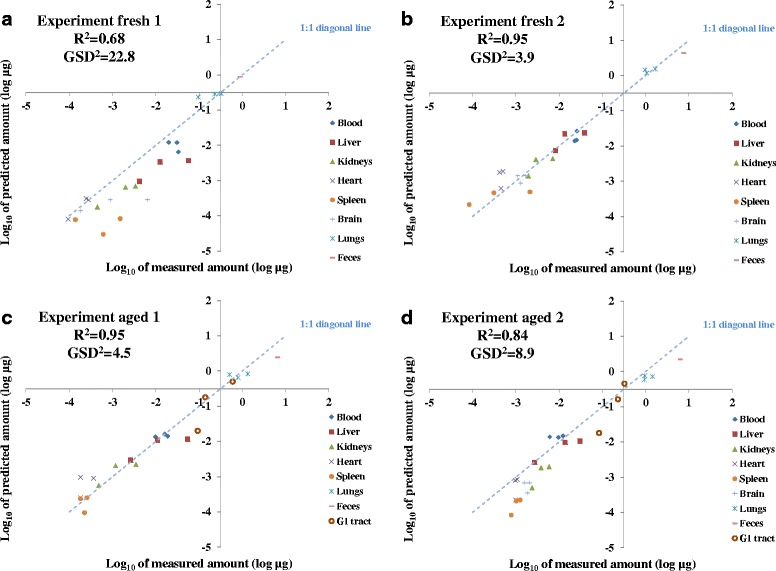
Fig. 6.

Log10 of predicted CeO2 nanoparticle amount as a function of log10 of measured amount in different organs. R2 represents the deviation from the line of unity between the log10 of measured and PBPK model predicted values. With R 2 = 1 representing perfect prediction of the measured CeO2 nanoparticle amount from the PBPK model. GSD2 indicates the differences (in factors) between the predicted and measured amounts of individual data points for all organs at all times. a Results for experiment fresh 1. b Results for experiment fresh 2. c Results for experiment aged 1. d Results for experiment aged 2
