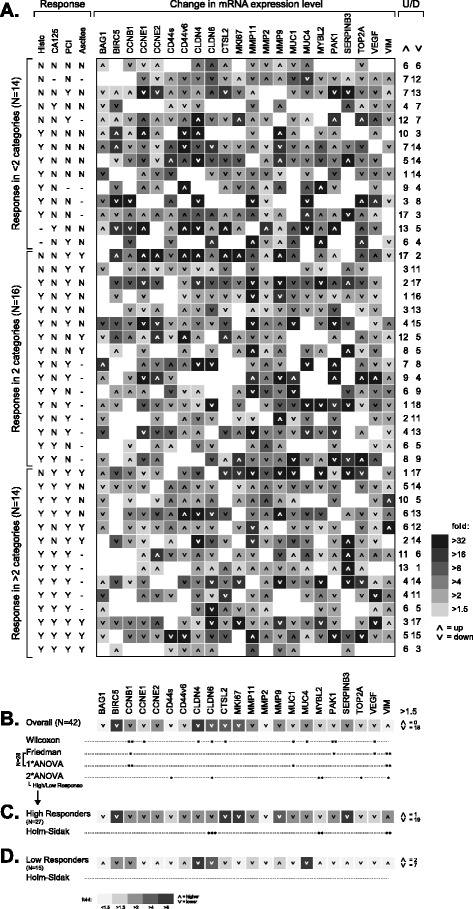
Fig. 3.

Heat map of gene expression changes in patient samples throughout IPC cycles a and of IPC-induced overall gene expression change b and in subset of high c and low response patients d judged by clinical response categories. a Each row represents a patient for whom an IPC-naïve tumor sample and at least one sample from PIPAC cycles 2 or 3 was available (n = 44), and each column corresponds to a specific gene. Patients (rows) were grouped according to treatment response as judged by histologic regression, decline of serum CA125 levels, improved PCI, and reduction of ascites volume as indicated in the columns to the left of the heat map (Y = response, N = no response, − = not applicable/data missing). b Statistical significance of expression change for individual genes was assessed by the Wilcoxon signed rank test, Friedman ANOVA on ranks (or one way [1*] ANOVA in case of normally distributed data; note that only data from a subset of 28 patients was considered; see text), and two way (2*) ANOVA using high/low clinical responders as additional factor. c, d Expression changes in samples of high and low responders and statistical significance assessed by the Holm-Sidak method of multiple pairwise comparison within the two way ANOVA described in B. a-d The magnitude of expression change is reflected by different levels of gray intensity (see legends); arrowheads indicate whether gene expression goes up or down in the course of IPC. The numbers of up-/downregulated genes are indicated at the far right. Statistical significance is indicated by asterisks (***, p < 0.001; **, p < 0.01; *, p < 0.05). A color version of the figure is available in Additional file 9
