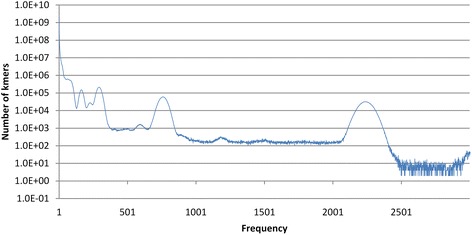
Fig. 1.

Frequency histogram of long k-mers computed from a simulated community genome. The histogram was generated by counting 20-mers from the synthetic dataset assembled from 500 distinct bacterial genomes, using 150 bp read length and an abundance distribution spanning 4 orders of magnitude (see Methods). k-mer frequencies are shown on the x axis; the number of distinct k-mers with a given frequency are shown on the y axis
