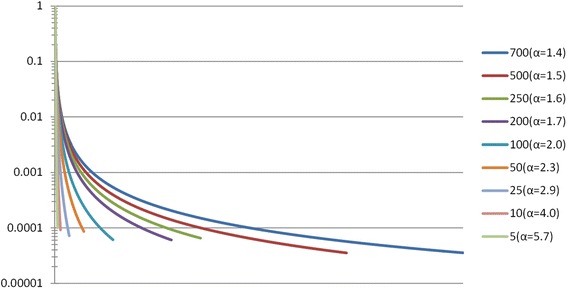
Fig. 2.

Abundance distributions of synthetic bacterial communities. Abundance distribution of sampled species for various datasets of increasing complexity, ranging from 5 to 700 distinct genomes (see main Text and Methods). A four order of magnitude difference between the number of cells from the most abundant versus less abundant organisms is used to determine power law parameters for each dataset (see Methods)
