Fig. 3.

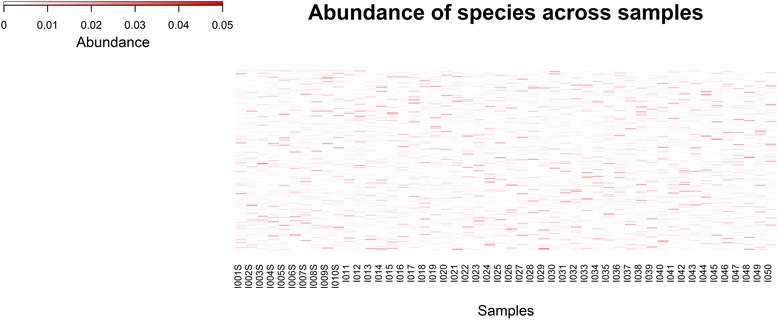
Heat map showing sampling levels for the 700 distinct genomes (rows) in each of the 50 samples (columns). Abundance levels of bacterial genomes across the 50 microbiome samples used to investigate the biomarker discovery use case

Heat map showing sampling levels for the 700 distinct genomes (rows) in each of the 50 samples (columns). Abundance levels of bacterial genomes across the 50 microbiome samples used to investigate the biomarker discovery use case