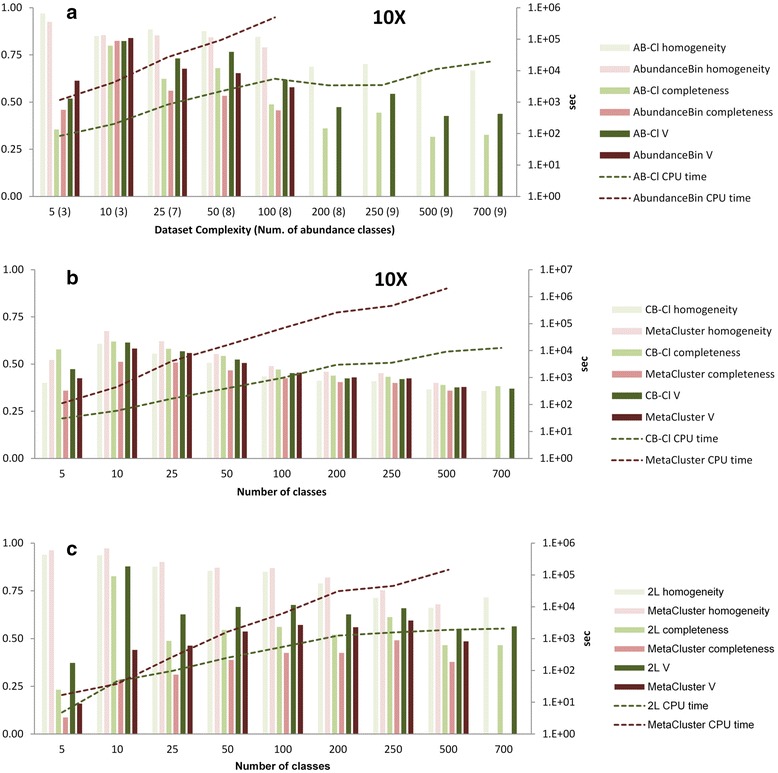
Fig. 4.

Evaluation of individual clustering modules and their chaining. a Comparison of the coverage-based clustering module (AB-Cl) versus AbundanceBin [8]. Groups of six bars for each sample of increasing complexity represent homogeneity, completeness and V1-measure (measured on the left axis) for AbundanceBin (red bars) and AB-Cl (green bars). Dotted lines denote execution time normalized per core (in logarithmic scale, on the right axis). Missing points result from AbundanceBin failing to process the datasets with 100 or more distinct genomes. b Comparison of the composition-based module (CB-Cl) versus MetaCluster [14]. Groups of six bars for each sample of increasing complexity represent homogeneity, completeness and V1-measure (measured on the left axis) for MetaCluster (red bars) and CB-Cl (green bars). Dotted lines denote execution time normalized per core (in logarithmic scale, on the right axis). Missing points result from MetaCluster failing to process the datasets with more than 500 distinct genomes. c Evaluation of the integrated two-level (2L) pipeline. The AB-Cl module was used for first level clustering, followed by either the CB-Cl module (green) or MetaCluster (red) for second level clustering. Dotted lines denote execution time normalized per core (in logarithmic scale, on the right axis). Missing points for the last dataset (700 distinct genomes) are due to the MetaCluster computation failing to complete
