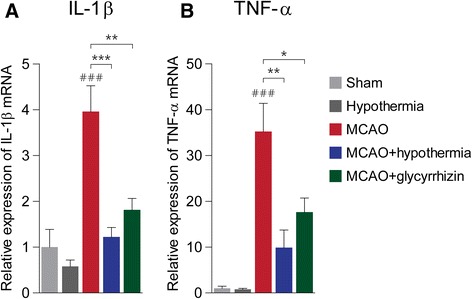
Fig. 6.

Pro-inflammatory cytokine expression in the peri-infarct region after MCAO. a, Quantification of interleukin-1β (IL-1β) expression by RT-PCR. ### P < 0.001 versus sham alone, ** P < 0.01, *** P < 0.001, one-way analysis of variance (ANOVA) followed by the Bonferroni post hoc test. b, Quantification of tissue necrosis factor-α (TNF-α) expression by RT-PCR. ### P < 0.001 versus sham alone, * P < 0.05, ** P < 0.01, one-way ANOVA followed by the Bonferroni post hoc test. The number of rats in each group was as follows: sham (n = 5), hypothermia (n = 5), MCAO (n = 8), MCAO + hypothermia (n = 6), MCAO + glycyrrhizin (n = 9)
