Fig. 2.

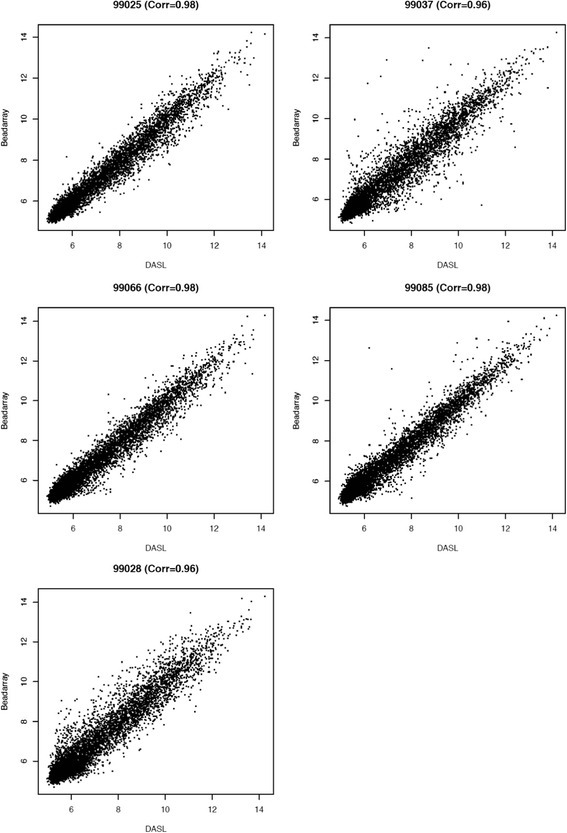
Scatter plots showing correlations of gene expression between FF vs. FFPE samples assessed using the DASL WG assay, following selection of the best performing probes

Scatter plots showing correlations of gene expression between FF vs. FFPE samples assessed using the DASL WG assay, following selection of the best performing probes