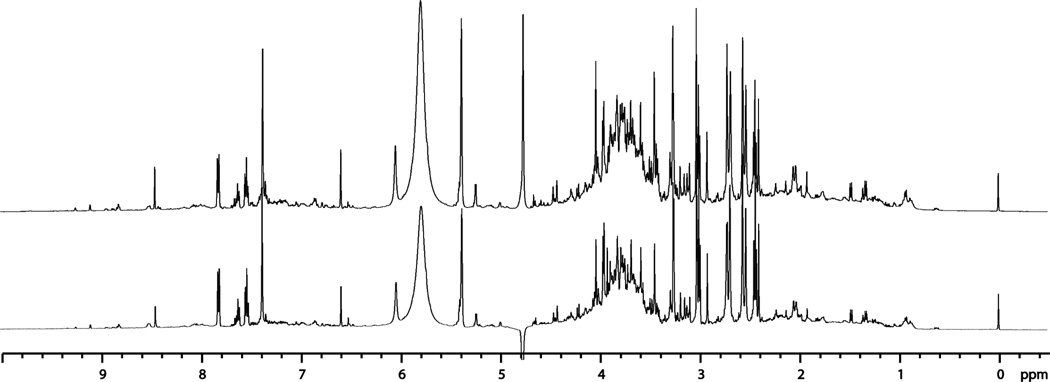
Figure 2.
1H NMR spectra of pnd 26-urine collected from male rat pups that had prior in utero exposure to BBP (bottom trace) or vehicle (corn-oil vehicle top trace) via the dams exposure during gestation. Quantitative differences in the levels of endogenous metabolites are indicated by differences in the relative ratios of signals. Signals for metabolites were matched with the quantitative library of metabolites.

