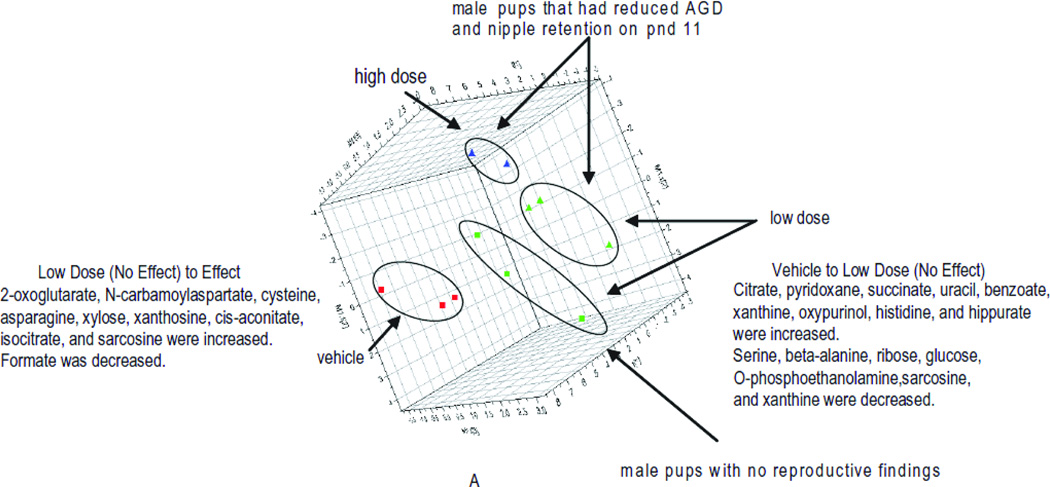
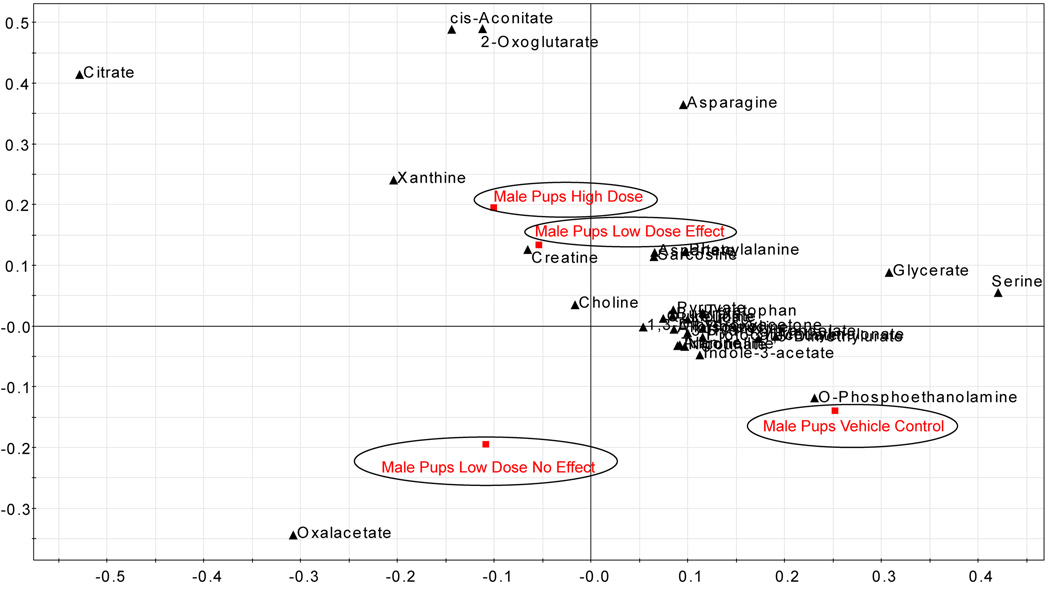
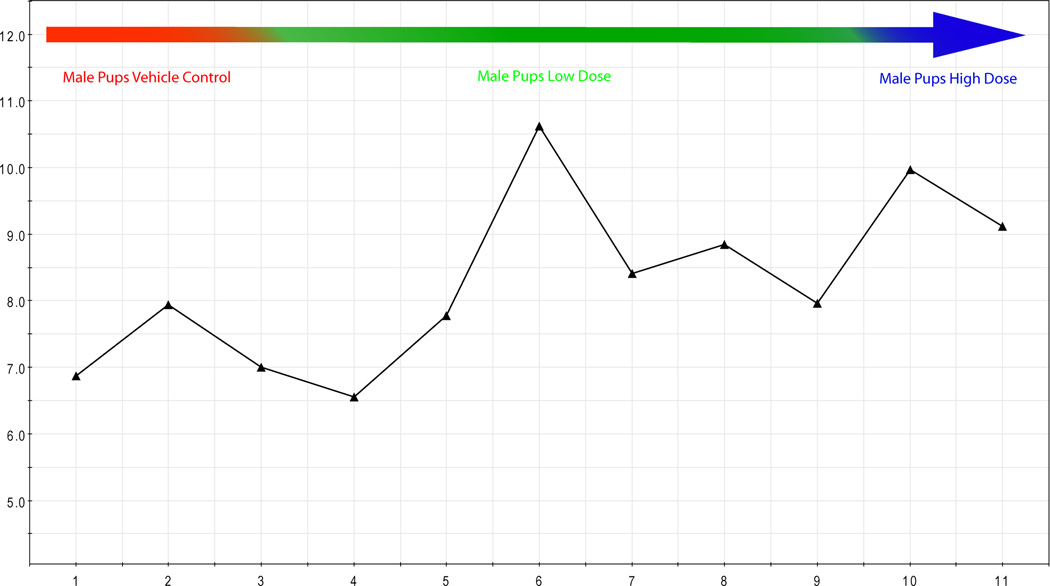
Figure 7.
a) Multivariate analysis of male pup urine (pnd 26) showed that pups from the low dose group with no reproductive findings (green square) had profiles more similar to the controls (red square) than the pups in low dose group that had reproductive findings prior to pnd 26 (green triangle). Control (red), low (green), or high (blue) dose groups are indicated by circled regions: triangle, reproductive findings at some time during study; square, no-effect male. b) The associated loading scatter plot indicated the metabolites that are increased or decreased for the respective study groups. c) The concentration of metabolites scaled to creatinine (y-axis) were visualized for each pup (pup identifier x-axis) to determine metabolites important in defining the study groups. Example shown for xanthine.


