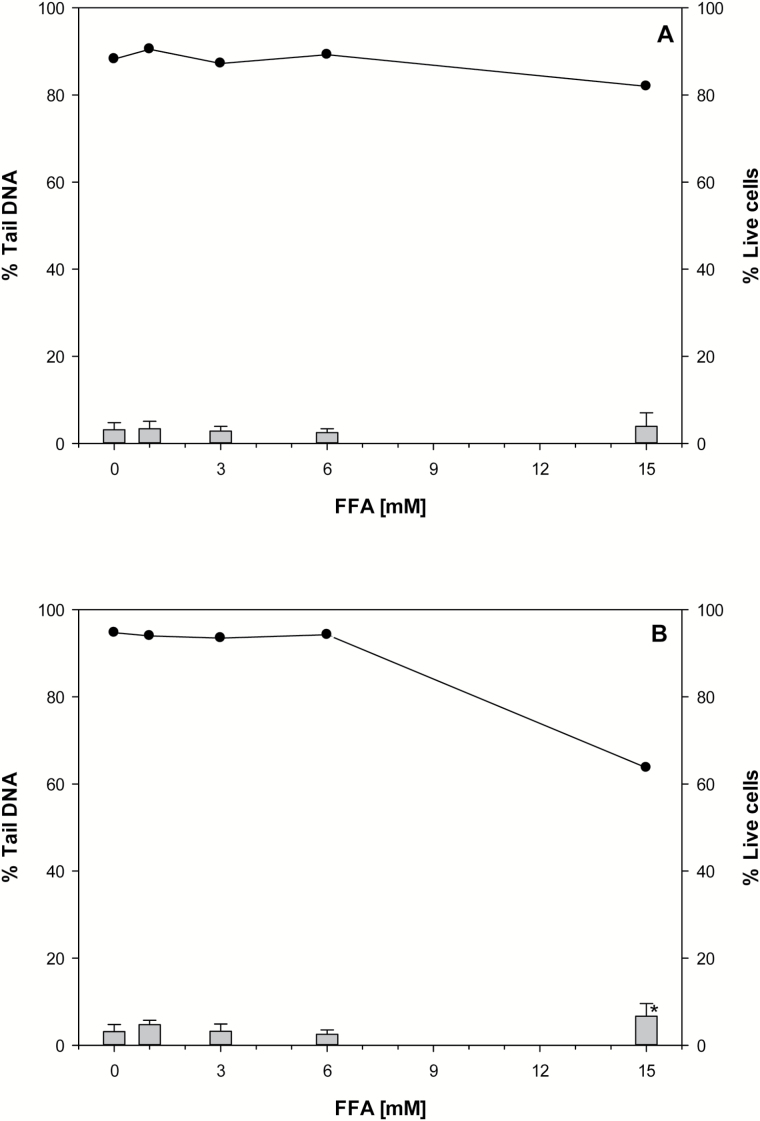
Figure 2.
Alkaline SCGE assay and cell viability of V79 cells (A) and V79-hCYP2E1-hSULT1A1 cells (B) exposed to FFA. DNA damage was detected after exposure to FFA for 3h. Vertical bars represent the mean from four experiments and whiskers indicate the standard deviation. The cell viability (•) is expressed as the mean of three experiments with (2,3) technical replicates within an experiment. Statistically significant differences against control; *P < 0.05.

