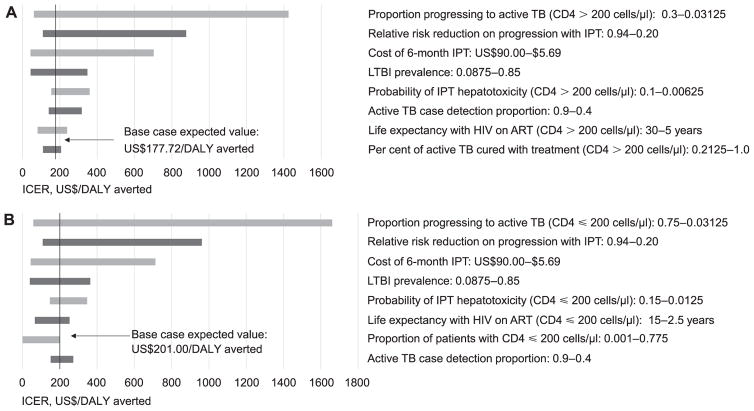
Figure 2.
Tornado diagrams showing one-way sensitivity analysis for ICERs of key model parameters in base case for both interventions. A) Intervention 1: IPT for CD4 > 200 cells/μl vs. SOC. B) Intervention 2: IPT for CD4 ≤ 200 cells/μl vs. SOC. Arrows = ICER at base-case estimates for all parameters. Not all parameters tested in the sensitivity analysis are shown. Ranges for parameters are shown next to parameter name. Only the top nine factors affecting ICER are shown. TB = tuberculosis disease; IPT = isoniazid preventive therapy; LTBI = latent tuberculous infection; HIV = human immunodeficiency virus; ART =antiretroviral therapy; DALY = disability-adjusted life-years; ICER = incremental cost-effectiveness ratio; SOC = standard of care.

