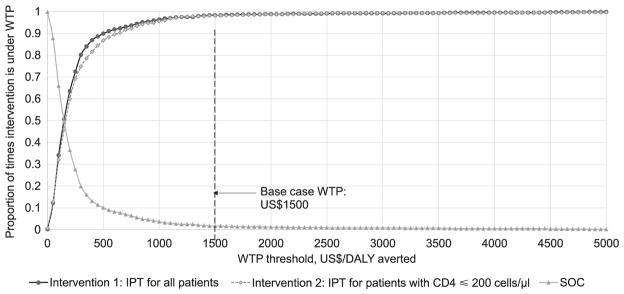
Figure 3.
Cost-effectiveness acceptability curve from probabilistic sensitivity analysis showing the percentage of simulations in which Intervention 1 or 2 would be considered cost-effective compared to current SOC at varying WTP thresholds. We also show the percentage of simulations in which SOC would be considered the preferred option compared to Intervention 1 and Intervention 2 at varying WTP thresholds. Arrow = WTP threshold of Indian gross per capita at US$1500.00/DALY averted. WTP = willingness to pay; DALY = disability-adjusted life-years; IPT = isoniazid preventive therapy; SOC = Standard of Care.

