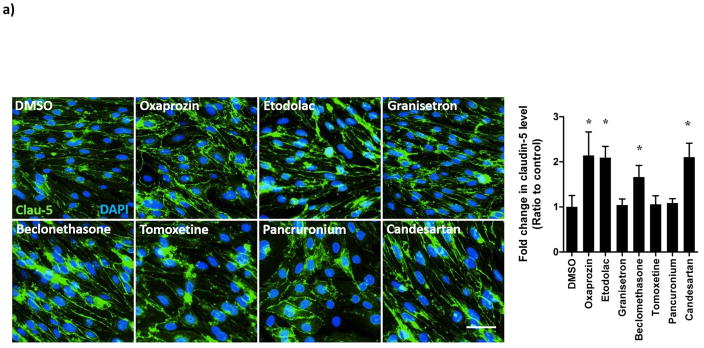
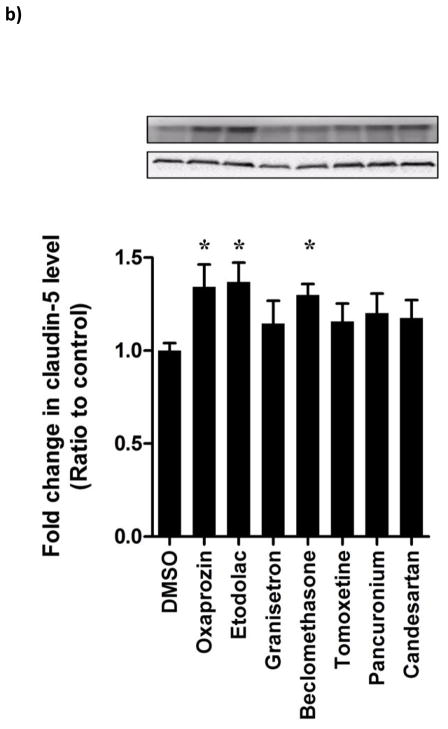
Figure 5.
(a) Representative images of claudin-5 in bEnd3 cells monolayers treated with hit FDA drugs showing localization and expression of claudin-5 in the membrane of bEnd3 cells (scale bar = 50 μm) (b) Representative blots and densitometry analysis for the effect of hit FDA drugs treatment on cluadin-5 expression determined by Western blot. Data represented as mean±SEM from 3 independent experiments. * P<0.05.


