
Figure 1. Proportions of Scores Outside Average Range.
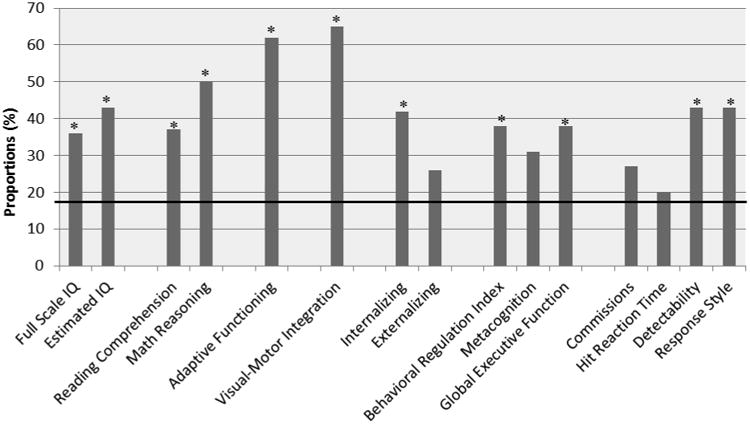
* Proportion of scores significantly different (1SD) than expected 16% in normative population
▬ Indicates 16% expected in normative sample
Official websites use .gov
A
.gov website belongs to an official
government organization in the United States.
Secure .gov websites use HTTPS
A lock (
) or https:// means you've safely
connected to the .gov website. Share sensitive
information only on official, secure websites.
* Proportion of scores significantly different (1SD) than expected 16% in normative population
▬ Indicates 16% expected in normative sample