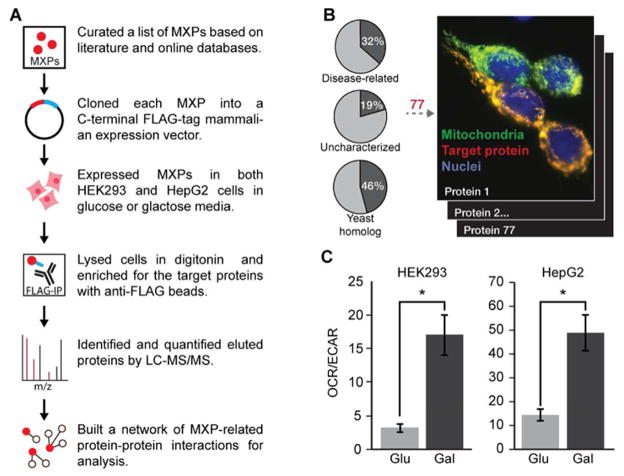
Figure 1. AE-MS methodology.
(A) Schematic workflow of the AE-MS method.
(B) Localization of all FLAG-tagged constructs was established based on MLS-GFP and anti-FLAG fluorescence microscopy (see Figure S1). Venn diagrams report the percentage of the MitoCarta+ list (Table S1) associated with each category.
(C) Galactose induces mitochondrial respiration. Ratio of rates of oxygen consumption (OCR) and extracellular acidification (ECAR) in HEK293 (left) and HepG2 (right) cells grown in 10 mM glucose (Glu) or galactose (Gal) for 24 hours prior to assay. OCR/ECAR is proportional to mitochondrial vs. glycolytic flux (* indicates t-test p-value < 0.05). Error bars indicate ± SEM.

