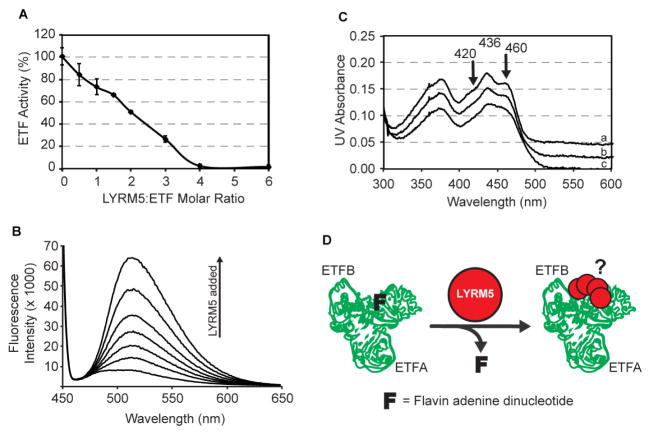
Figure 6. LYRM5 deflavinates ETF.
(A) ETF activity in the presence of increasing amounts of LYRM5 (± SD from triplicate measurements).
(B) FAD release from ETF upon incubation with varying amounts of LYRM5, measured by fluorescence emission spectroscopy.
(C) Visible spectra of ETF in the presence of LYRM5. The flavin visible spectrum shows two shoulder peaks at 420nm and 460nm due to the interaction between FAD and ETF protein residues that are lost upon addition of LYRM5. Spectrum a, b, and c are for LYRM5:ETF ratios of 0, 2, and 4, respectively. For clarity, spectra a and b have been shifted by +0.04 and 0.02 OD units, respectively.
(D) Proposed model of the functional interaction between LYRM5 and ETF. Binding of four molar equivalents of LYRM5 (red dot) to ETF (green trace of PDB ID 1EFV) leads to the loss of FAD from ETF (F).

