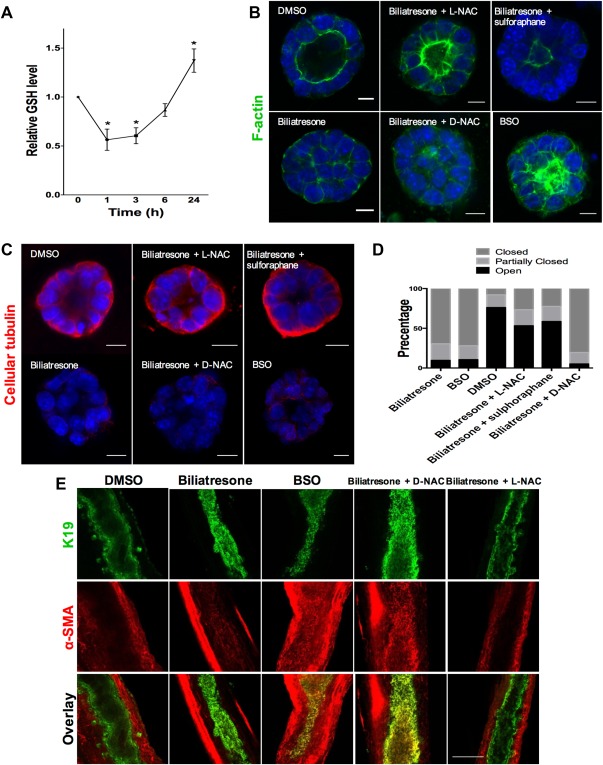
Figure 5.

The effects of biliatresone are secondary to decreased GSH. (A) GSH levels were measured in cholangiocytes in two‐dimensional (2D) culture over 24 hours after treatment with biliatresone. Data are presented as the mean ± standard error of the mean. *P < 0.05 (versus 0 time point) and are from three independent experiments, each with three technical replicates. (B) Cholangiocyte spheroids in 3D culture were treated with the compounds indicated for 24 hours and were then immunostained for F‐actin (green) and with the nuclear stain DAPI (blue). Only spheroids that were fully visualized along the z axis were scored. Scale bars: 10 μM. (C) Spheroids treated as described in panel B and, immunostained for cellular tubulin (red). Scale bars: 10 μM. (D) Quantification of the spheroids from panel B. Spheroids (96‐119) in three different experiments for each condition were graded as open (lumen wide open), partially closed (small lumen), or closed (obstructed lumen). (E) Immunofluorescence staining of neonatal mouse EHBDs incubated for 24 hours in a high‐oxygen environment (see Materials and Methods), treated with the compounds indicated and immunostained for K19 (green) and α‐SMA (red). Scale bar: 100 μM. Images are representative of (B,C) three independent experiments, each of which was performed in duplicate, and (E) four independent experiments with at least eight ducts for each condition.
