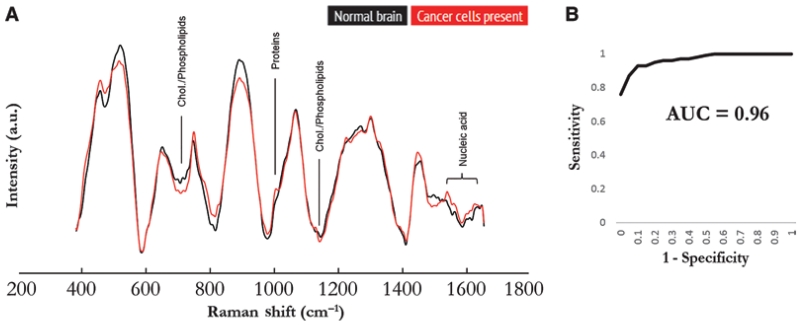
Fig. 1.
Raman spectra for discrimination of cancer tissue. A: Average Raman spectra of in vivo measurements for normal brain (all 66 spectra averaged) and tissue containing glioma cancer cells (all 95 spectra averaged). Corresponding molecular contributors are identified for the most significant differences between the spectra for normal and cancer tissues. Chol. = cholesterol. B: Receiver operating characteristic curve analysis of in vivo detection of glioma based on Raman spectroscopy, generated using the boosted trees classification method. AUC = area under the curve. From Jermyn M, Mok K, Mercier J, Desroches J, Pichette J, Saint-Arnaud K, et al: Intraoperative brain cancer detection with Raman spectroscopy in humans. Sci Transl Med 7:274ra219, 2015. Reprinted with permission from AAAS.

