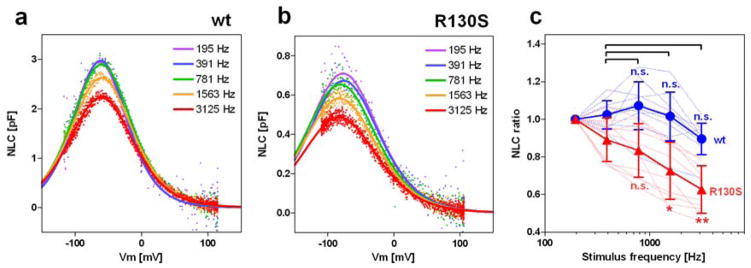
Fig. 5.
Functional effect of the R130S mutation on motor kinetics. NLC was measured using five different f1 frequencies (195, 390, 781, 1563, and 3125 Hz) with the corresponding f2 frequencies being twice as large as f1. Representative recordings for wt-prestin-ECFP (a) and R130S-prestin-ECFP (b) are shown. The obtained Qmax values were divided by those determined at 195 Hz, and resulting quotients plotted against the f1 stimulus frequency in panel c. The results for wt-prestin (n=10) and R130S-prestin (n=10) are shown in blue and red, respectively as means and standard deviations. Thin broken lines indicate individual recordings whereas the thick solid lines indicate the means. Single and double asterisks indicate statistical significance with p<0.05 and p<0.01, respectively. “n.s.” indicates p>0.05. The p-values were computed using a Tukey multiple comparison test.

