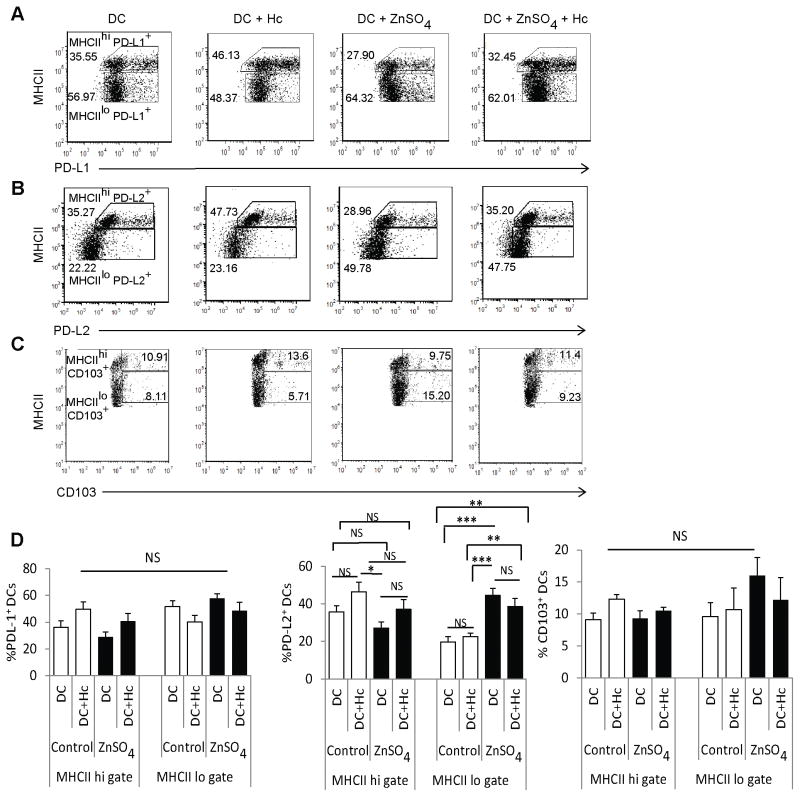
Fig. 2. Zn shapes tolerogenic DC phenotype.
A–C) Dot plots represent PD-L1+, PD-L2+ and CD103+ DCs in MHCIIhi and MHCIIlo gates, numbers in plots are percent values; D) Graphical representation of percent PD-L1+ (4 independent experiments), PDL2+ (6 independent experiments) and CD103+ DCs (3 independent experiments) in MHCIIhi and MHCIIlo gates; Data presented as mean ± SEM, * p< 0.05; ** p< 0.01; *** p< 0.001; NS, not significant by two way ANOVA.

