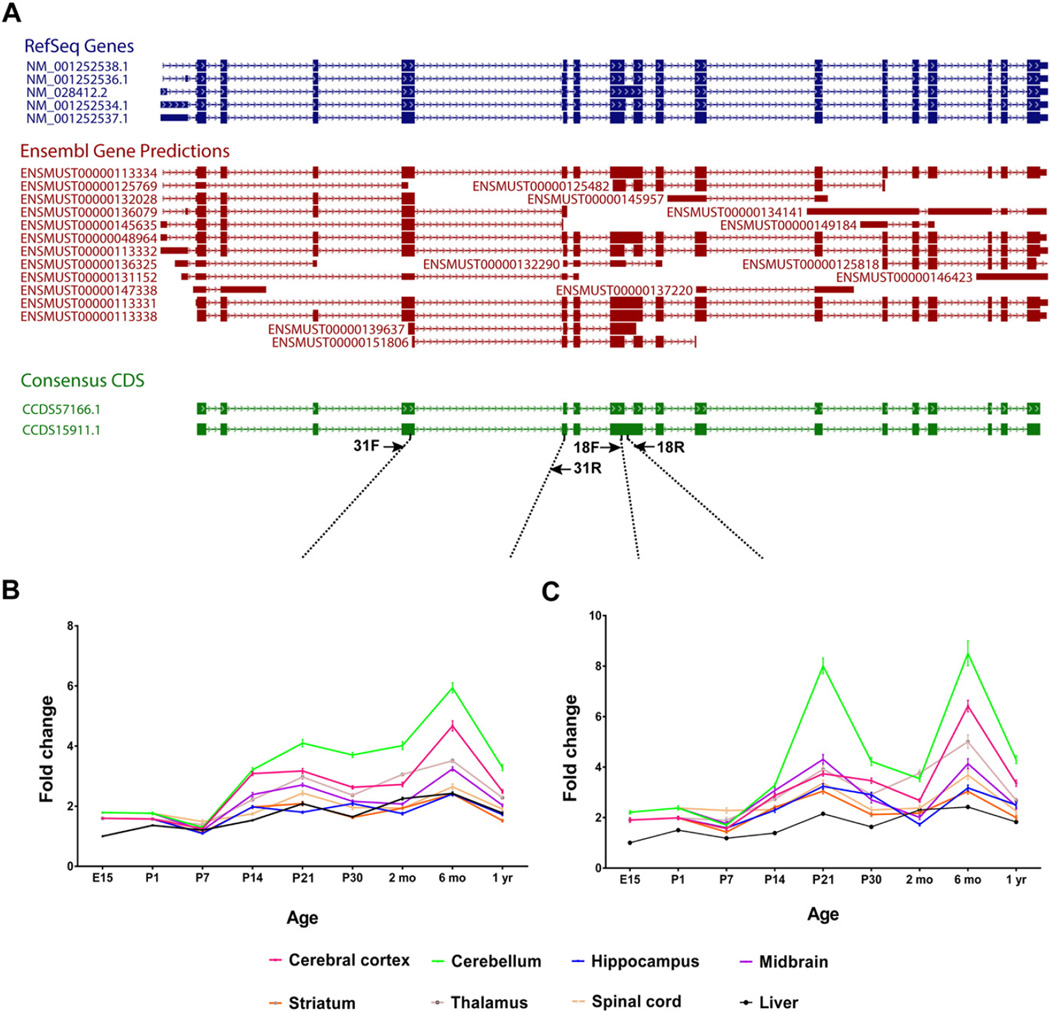
Fig. 1.
(A) Schematic representation of Ciz1 isoforms. Two distinct primer pairs were designed to examine expression of both CCDS isoforms, in aggregate, or the longer isoform (CCDS15911.1), in isolation, with β-actin as the endogenous control. Primers pairs: 31F/31R and 18F/18R. Relative to E15 liver, neural expression of Ciz1 isoforms amplified by primer pair 31F/31R (B) and primer pair 18F/18R (C) increase with increasing postnatal age. Among those neural structures subjected to analysis, Ciz1 expression was highest in cerebellum.

