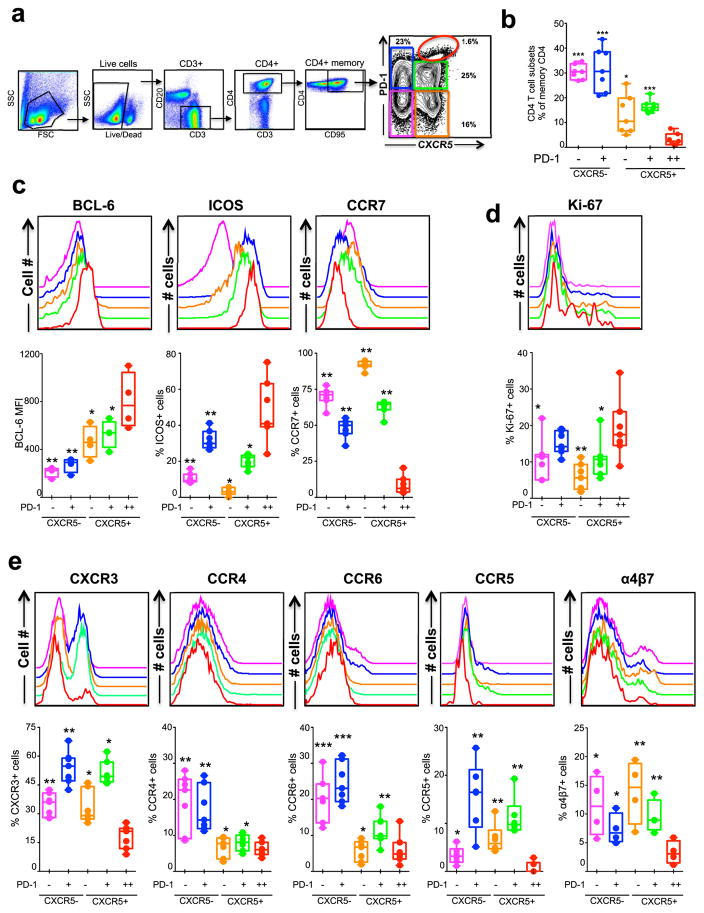
Figure 1. Characterization of five memory CD4 T cell subsets defined based on CXCR5 and PD-1 expression in the lymph node (LN) of SIV naïve rhesus macaques (RM).
(a, b) Relative distribution of five memory CD4 T cell subsets (CD95+ CD4+ cells) in the LN defined based on CXCR5 and PD-1 expression. Representative flow plot is shown in (a) and summary for a group (n=7) of SIV-naïve RM is shown in (b). (c) Expression of Tfh markers Bcl-6 and ICOS, and non-Tfh marker CCR7 (n=7). (d) Expression of proliferation marker Ki-67 (n=7). (e) Expression of different chemokine receptors CXCR3, CCR4, CCR6, CCR5 and α4β7 (n=7 except for α4β7 for which n=4). P values shown are for CXCR5+ PD-1++ (GC-Tfh) subset vs other subsets. *p < 0.05, **p < 0.01, ***p < 0.001, ****p < 0.0001. The legend for histogram plots shown in c–e is shown in b.

