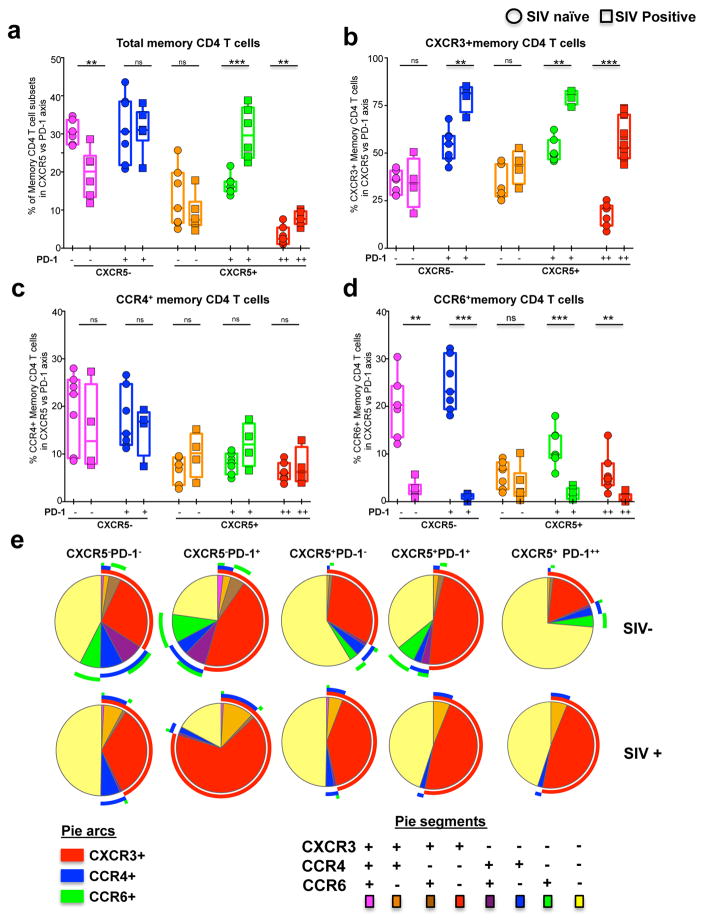
Figure 2. Enrichment of CXCR3+ CD4 T cells in the LN during chronic SIV infection.
(a) Relative distribution of five memory CD4 T cell subsets in the LN defined based on CXCR5 and PD-1 expression before and after (24 weeks) SIV infection. Expression of CXCR3 (b), CCR4 (c) and CCR6 (d) on five memory CD4 T cell subsets defined based on CXCR5 and PD-1 expression before and 24 weeks after SIV infection. (e) Pie charts summarizing the co-expression of chemokine receptors CXCR3, CCR4 and CCR6 on different memory CD4 T cell subsets. Red arcs identify CXCR3+ populations, blue arcs identify CCR4+ population, green arcs identify CCR6+ population. Data for seven SIV− and SIV+ animals are shown.

