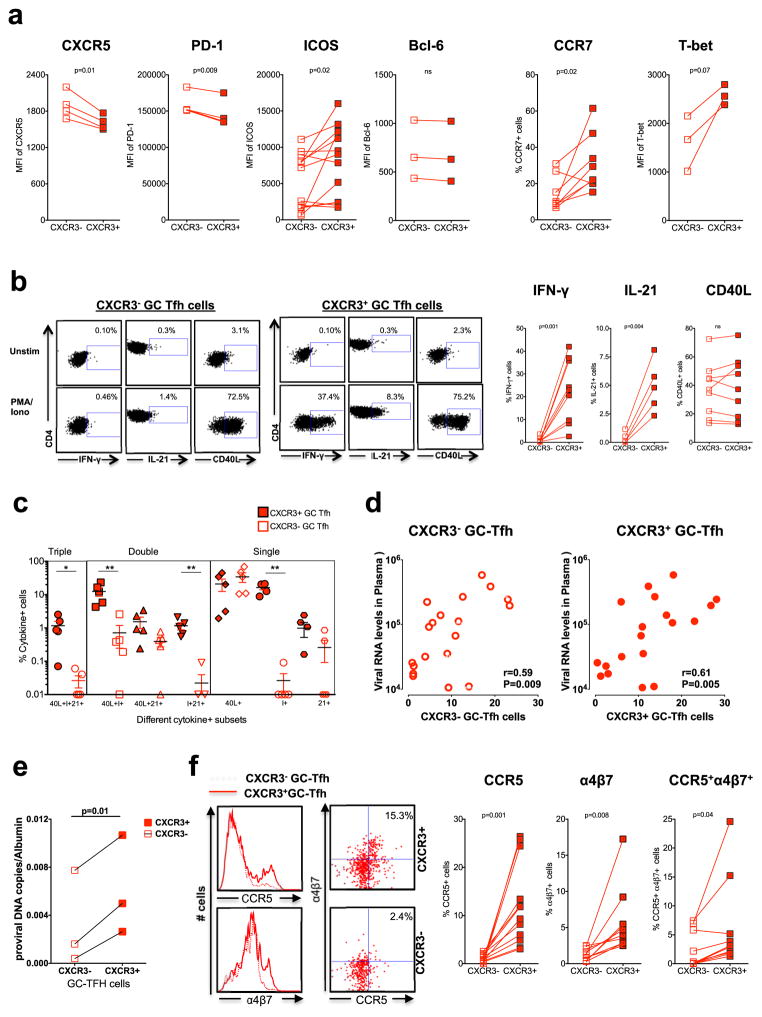
Figure 3. CXCR3+ GC-Tfh cells are phenotypically and functionally distinct from CXCR3− GC-Tfh cells.
(a) Expression of Tfh and Th1 markers on CXCR3+ and CXCR3− GC-Tfh cells (b) Expression of IFN-γ, IL-21 and CD40L by sorted CXCR3+ and CXCR3− GC-Tfh cells following stimulation with PMA/Ionomycin. Representative flow plots are shown on the left. (c) Boolean analysis determining co-expression of IFN-γ, IL-21 and CD40L. (d) Correlation between CXCR3+ GC-Tfh or CXCR3− GC-Tfh and plasma viral RNA levels at 24 weeks post SIV infection. (e) Copies of SIV proviral DNA in sorted CXCR3+ and CXCR3− GC-Tfh cells. (f) Expression of CCR5 and α4β7 on CXCR3+ and CXCR3− GC-Tfh cells.

