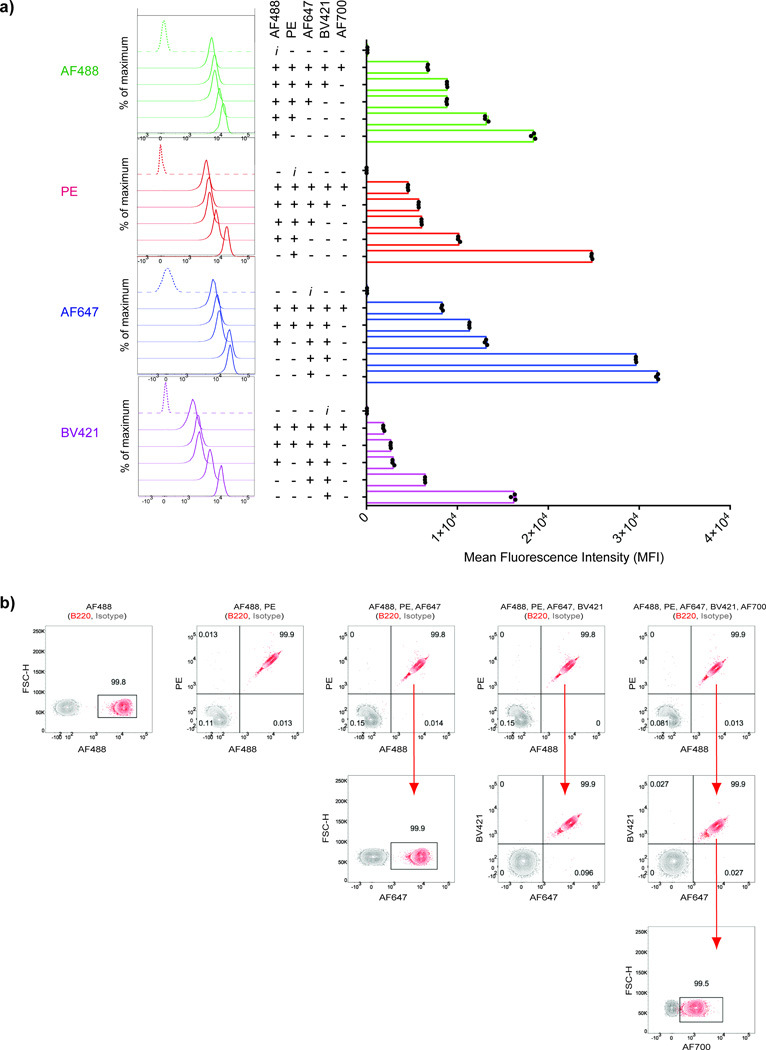
Figure 2.
The decrease in the fluorescence intensity of individual Fl-Ab when combined with multiple other Fl-Abs does not interfere with the identification of barcoded populations. a) anti-B220-Fl-Abs conjugated to either AF488, PE, AF647, BV421 or AF700 and their isotype-matched controls were used to stain purified B cell populations in multiple combinations. The histograms (left) and the MFI values (right) for each fluorochrome are given in comparison with the fluorescently-labeled isotype control Ab. Individual values of triplicate observations are shown as black dots on the MFI column graph. b) B cell samples were stained using the combinations of anti-B220-Fl-Abs (red contour plots) or appropriate fluorescently-labeled isotype control Ab (grey contour plots) and analyzed by flow cytometry. Contour plots are superimposed to determine the boundaries of positive gates. Numbers refer to the percentages of cells positively stained with anti-B220-Fl-Abs for each flow cytometry plot. Results are representative of three independent observations.

