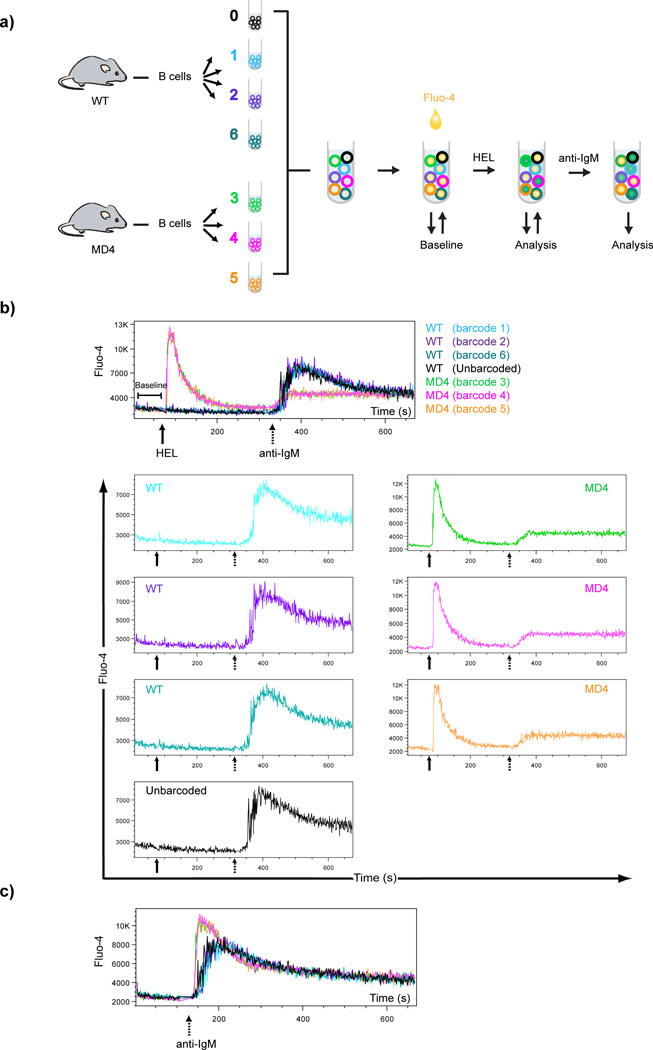
Figure 4.
Ab-based barcoding as a means to standardize conditions in real time Ca2+ flux assays. a) Samples of B cells purified from WT C57BL/6 mice (barcodes 1,2,6 and unbarcoded) and HEL transgenic MD4 mice (barcodes 3,4,5) were barcoded, pooled and stained with Fluo4 as shown. After a baseline measurement, pooled sample were stimulated with approximately 2 µg/ml HEL protein and Ca2+ uptake analyzed for 5 min. Cells were then stimulated with approximately 10 µg/ml anti-IgM and Ca2+ uptake and analyzed for 5 min. b) Fluo4 intensity histogram overlays of all samples (top panel) as well as individual histograms (bottom panels) over time are shown. Continuous (HEL) and dotted (IgM) arrows indicate the time points when stimuli were added. c) Histograms of Fluo4 intensity for all samples treated with anti-IgM are shown. Data shown are representative of at least four independent experiments.

