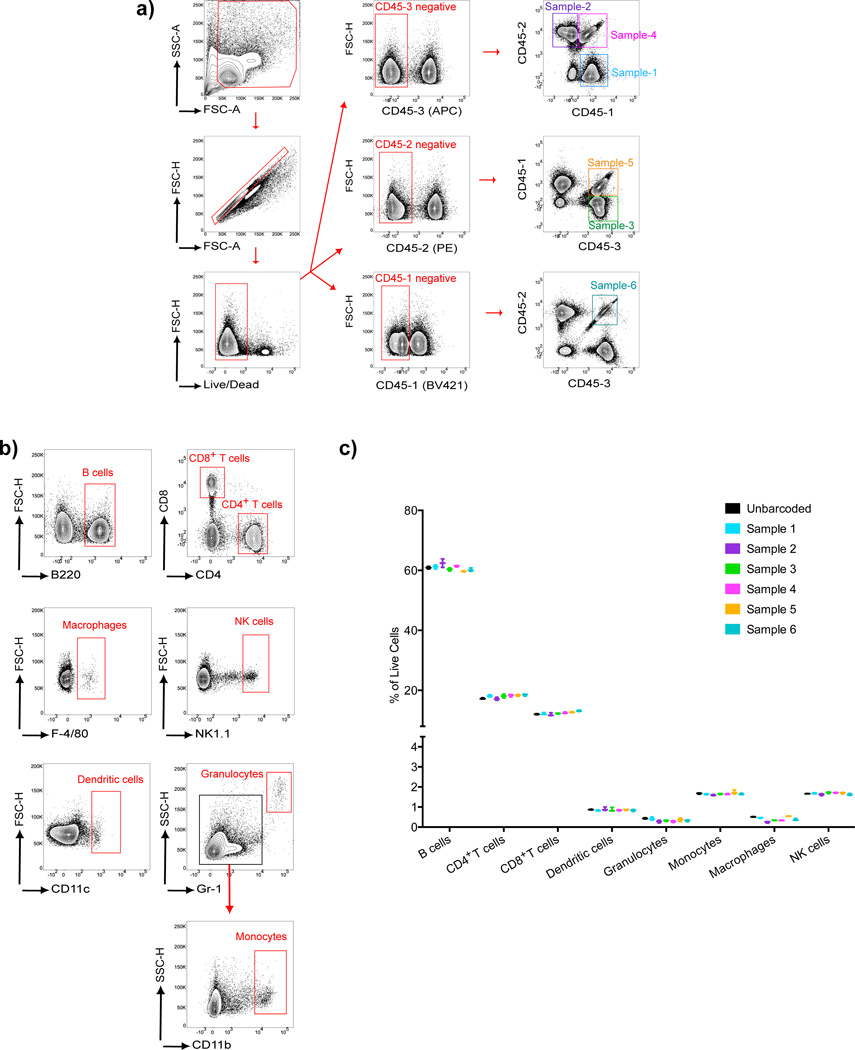
Figure 6.
Ab-based barcoding applied to immune cell phenotyping. Splenocytes harvested from C57BL/6 mice were divided into six samples that were barcoded using three different anti-CD45-Fl-Abs and then pooled. The pooled samples and a separate unbarcoded sample of splenocytes were stained with immune cell phenotyping Abs specific for: B220, CD4, CD8, F4/80, NK1.1, CD11c, Gr1 or CD11b. a) Flow cytometry plots showing the gating strategy for the identification of the six uniquely barcoded cell samples. b) Gating strategy used for identification of B cells, T cells, macrophages, NK cells, dendritic cells, granulocytes and monocytes within the mixed splenocyte population. c) Cell subsets were quantified as the percentage of live cells within each barcoded sample and the unbarcoded sample and values obtained from three parallel sets of barcodes and three unbarcoded samples are given. Error bars show the range between the minimum and maximum of observed values. Results are representative of three independent experiments.

