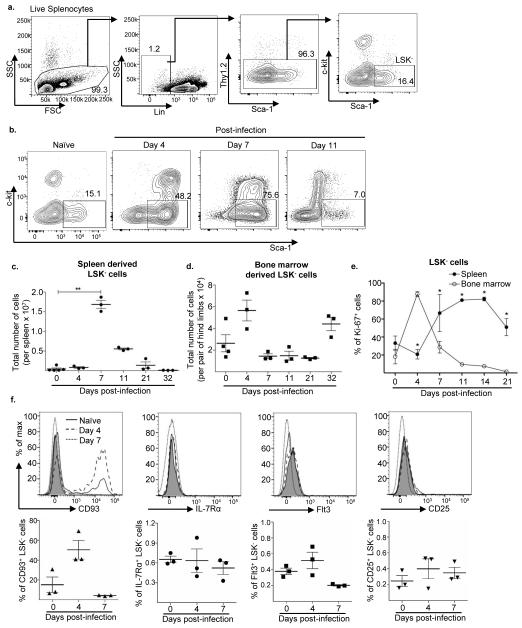
Figure 1. A LSK− progenitor population emerges in the spleen after P. yoelii infection.
a. Splenocytes from naïve C57BL/6 mice were stained with the indicated antibodies and the gating strategy used to select for Lin−Sca-1+c-kit− (LSK−) cells is shown. Lineage (Lin) cocktail included antibodies to CD3, CD4, CD5, B220, CD11b, CD11c, Ter-119, NK1.1, and Gr-1. b. Representative flow plots of LSK− cells from the spleen of C57BL/6 mice infected with P. yoelii 17X at days 0, 4, 7 and 11 p.i. Total number of LSK− progenitor cells in the c. spleen and d. bone marrow after P. yoelii 17X infection of C57BL/6 mice at days 0, 4, 7, 11, 21 and 32 p.i. **, p = 0.0062 (Kruskal-wallis non-parametric ANOVA). e. Percentage of LSK− cells expressing nuclear antigen Ki-67 from the spleen (filled circle) and bone marrow (empty circle) of C57BL/6 mice following P. yoelii 17X infection at days 0, 4, 7, 11, 14, and 21 p.i. *, p<0.001 (two-way ANOVA). f. Representative histogram plots and percentage of splenic LSK− cells from C57BL/6 mice showing expression of CD93 (triangle), IL-7Rα (circle), Flt3 (square), and CD25 (inverted triangle) at days 0 (solid line), 4 (dashed line), and 7 (dotted line) after P. yoelii 17X infection. The FMO (fluorescent minus one) controls are shown as grey filled histograms. Data are representative of three independent experiments with n = 3 mice per group/time point; Error bars (c-f) S.E.M.

