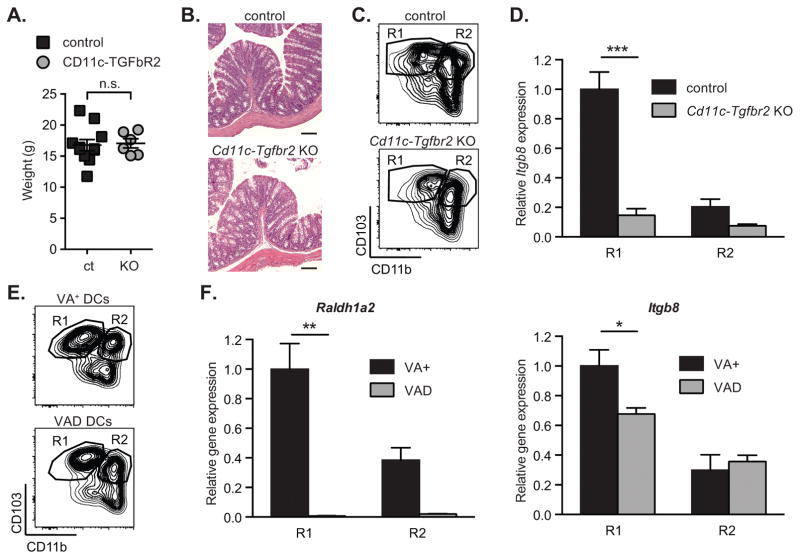
Figure 3. Reduced expression of β8 integrin expression in retinoic acid- and TGF-β signaling-deficient mice.
β8 integrin (Itgb8) expression was assessed in MLN DC subpopulations FACS-sorted from control, CD11c-Tgfbr2 KO mice (A–D) and animals fed with a vitamin A-deficient (VAD) or -sufficient (VA+) diet (E–F). (A) Weight and (B) representative haematoxylin- and eosin-stained sections of colons from CD11c-Tgfbr2 KO and control mice. Scale bar, 100 μm. (C, E) Representative FACS plot of CD11c+MHC-II+ DCs from MLN showing gating strategy for isolating indicated populations. (D, F) Quantitative RT-PCR analysis of Itgb8 (D, F right panel) and Raldh1a2 (F, left panel) expression relative to Actb and presented relative to levels in control CD103+CD11b− DCs (R1) in indicated MLN DC subpopulations. All histograms show mean ± SEM of at least 6 individual mice from 3 separate experiments. *, p< 0.05; **, p<0.005; ***, p<0.0005; two-way ANOVA with Tukey’s post-hoc test.

