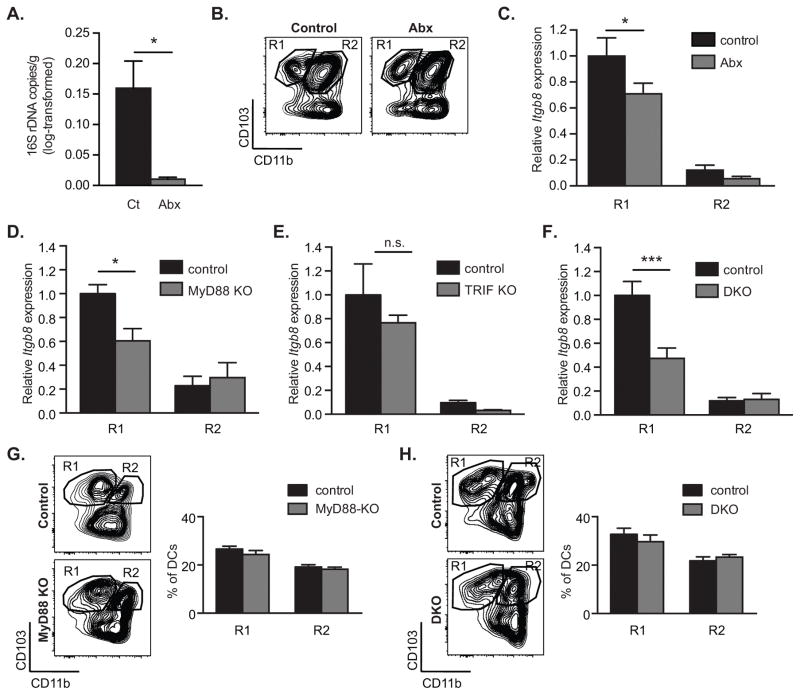
Figure 4. Intestinal microbes and MyD88 signaling promote β8 integrin expression in CD103+CD11b− MLN DCs.
β8 integrin (Itgb8) expression was assessed in MLN DC subpopulations FACS-sorted from control, antibiotics-treated (A–C), MyD88- (D, G), TRIF- (E) and MyD88-TRIF-deficient (F, H) mice. (A) Log-transformed 16S rDNA copy numbers per gram of stool in control and antibiotics-treated (Abx) animals, as determined using real-time PCR. (B) Representative FACS plot of CD11c+MHC-II+ DCs from MLN showing gating strategy for isolating indicated populations. (C–F) Quantitative RT-PCR analysis of Itgb8 expression relative to Actb and presented relative to levels in control CD103+CD11b− DCs (R1) in indicated MLN DC subpopulations in control and antibiotics-treated (C), MyD88-deficient (MyD88 KO) (D), TRIF-deficient (TRIF KO) (E) and MyD88-TRIF-deficient mice (DKO) (F). (G–H) Representative FACS plot and frequencies of CD11c+MHC-II+ DCs from MLN of MyD88-KO (G) and Myd88-TRIK DKO mice (H). Histograms show mean ± SEM of n individual mice from 1 (E, n=3), 2 (D, n≥8, F, n≥6) or 3 (C, n≥5) separate experiments. *, p<0.05; ***, p<0.0005; unpaired student t test (A) or two-way ANOVA with Tukey’s post-hoc test (C–H).

