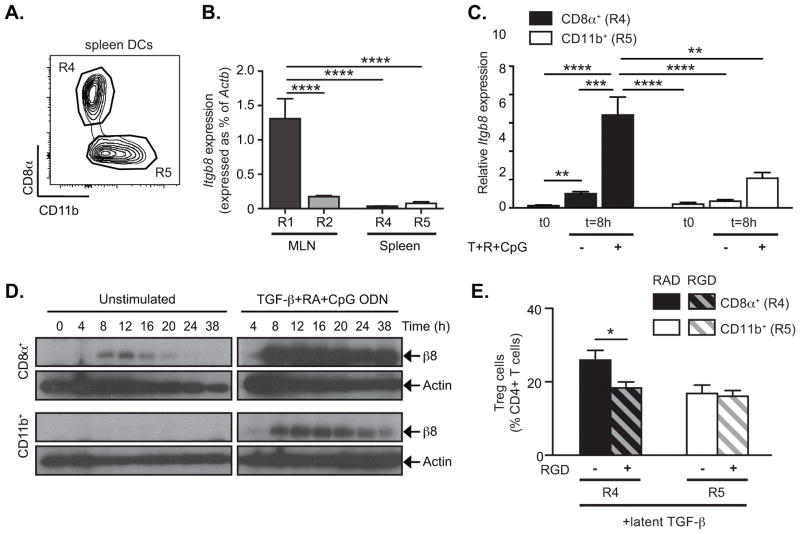
Figure 7. CD8α+ spleen DCs preferentially express αvβ8 and generate Treg in vitro.
DC subsets were sorted by FACS. (A) Representative FACS plot gated on CD11c+MHC-II+ DCs from spleen shows gating strategy for isolating indicated populations. MLN DC subsets were sorted as is Figure 1. (B) β8 integrin gene (Itgb8) expression was analyzed by quantitative RT-PCR in freshly isolated DC subsets from MLN and spleen and expressed as % of Actb. (C–D) Sorted DC subsets were cultured in serum free medium for 8h (C) or indicated times (D). Cells were either left untreated (−) or stimulated with TGF-β, RA and CpG ODN (+) and harvested either in TRIzol (C) or RIPA buffer (D) for analysis of β8 integrin expression. Alternatively for each freshly isolated DC subsets, their ability to induce Treg generation was assessed in vitro (E). (C) Quantitative RT-PCR analysis of Itgb8 expression relative to Actb and presented relative to levels in unstimulated (−) CD8α+ DCs (R4). (D) Western blot analysis of β8 integrin and β-actin. (E) FACS-sorted spleen DC subsets were cultured with naïve CD4+Foxp3GFP− T cells in serum-free medium with or without addition of latent TGF-β, RGD (+, hatched bars) and/or RAD (−, solid bars) peptides as indicated. After 4 days in culture, Treg generation was assessed by Foxp3GFP expression. Data show mean ± SEM of individual DC:T cell cultures with 8 independent pools of spleen DCs from two separate experiments. Histograms show mean ± SEM of n independent pools of mice from 2 (B, n=5) or 4 (C, n=10) separate experiments. *, p<0.05; **, p<0.005; ***, p<0.0005; ****, p<0.0001; one-way ANOVA with Dunnet’s post-hoc test (B) or two-way ANOVA with Tukey’s post-hoc test (C, E).

