
Figure 2.
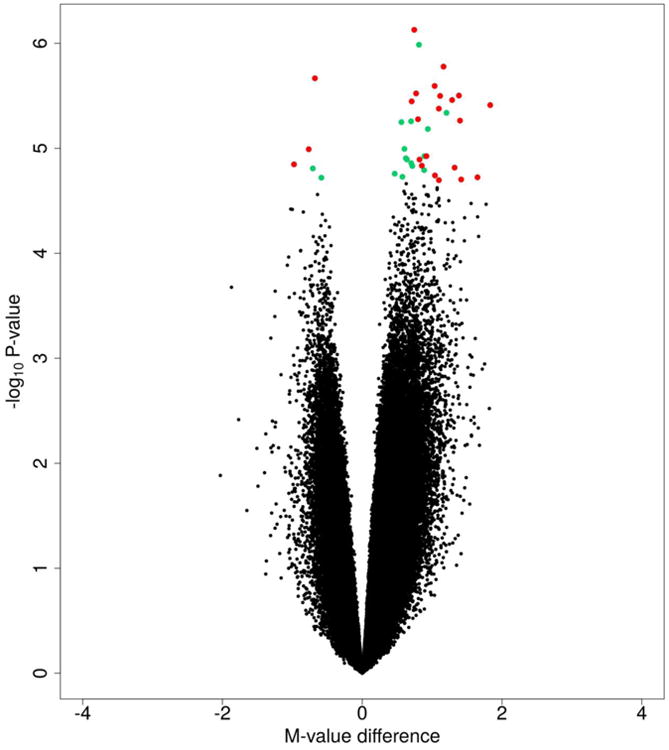
Volcano plot for African American patients with prostate cancer recurrence compared to those with no evidence of recurrence. Green = CpG sites with FDR q ≤ 0.25; Red = CpG sites with FDR q ≤ 0.25 and mean methylation β value difference ≥ 0.10.