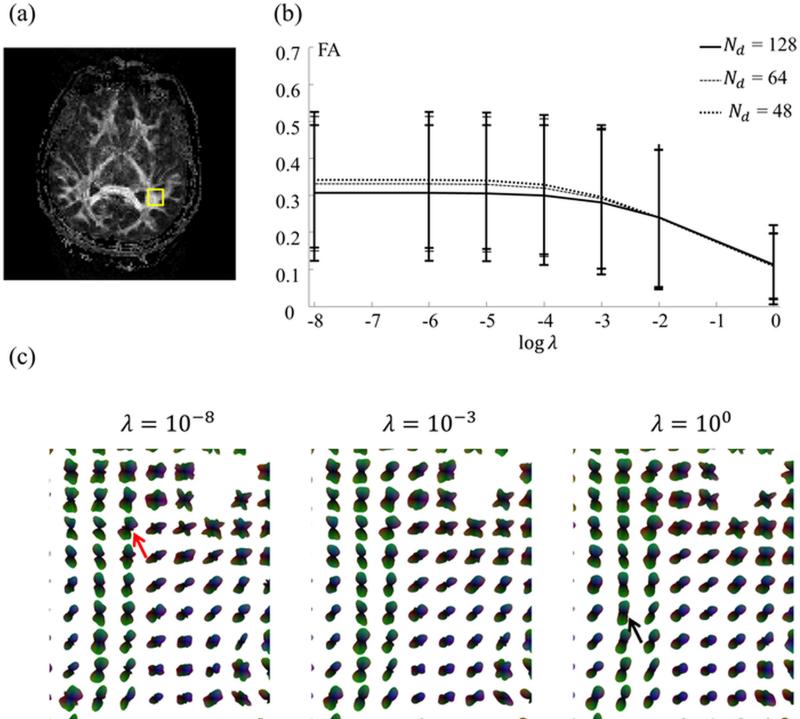
Fig. 2.
Images were reconstructed while varying λ in Eq. 3 (Subject #6, 64 directions). The mean as well as standard deviation of the FA value, calculated over the ROI shown in (a), is plotted in (b) as a function of λ. (c) Similarly, choices in λ also affected the shape of the ODFs. Although changes in 3D objects such as an ODF may be difficult to visualize, distortions at low / high λ values can be seen here, for example the red arrow in (c) pointing to a noise-induced secondary peak in the 10−8 case, and the black arrow pointing to a swollen ODF in the 10° case. A setting near the point of inflexion in (b) was chosen, λ = 5 × 10⁻³, and adopted for all results presented below.

