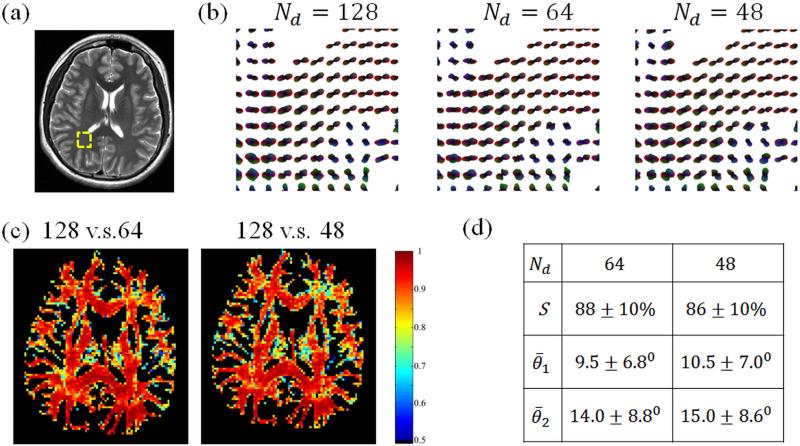
Fig. 6.
ODF maps (b) and similarity maps (c) are shown for all 3 scans performed with Subject #6. Visually-good geometrical fidelity was achieved compared to the T2-weighted image in (a). The similarity and the angular dispersion indices for peak directions of the slice are shown in the table (d) using the 128-direction data as the reference. The ODF maps in (b) correspond to the ROI shown in (a) as on overlay to the T2-weighted image.

